EDS 240: Discussion 4

Recreating US Drought Monitor viz

Part 2: ggplot themes


Week 4 | January 27th, 2024

Themes modify non-data plot elements


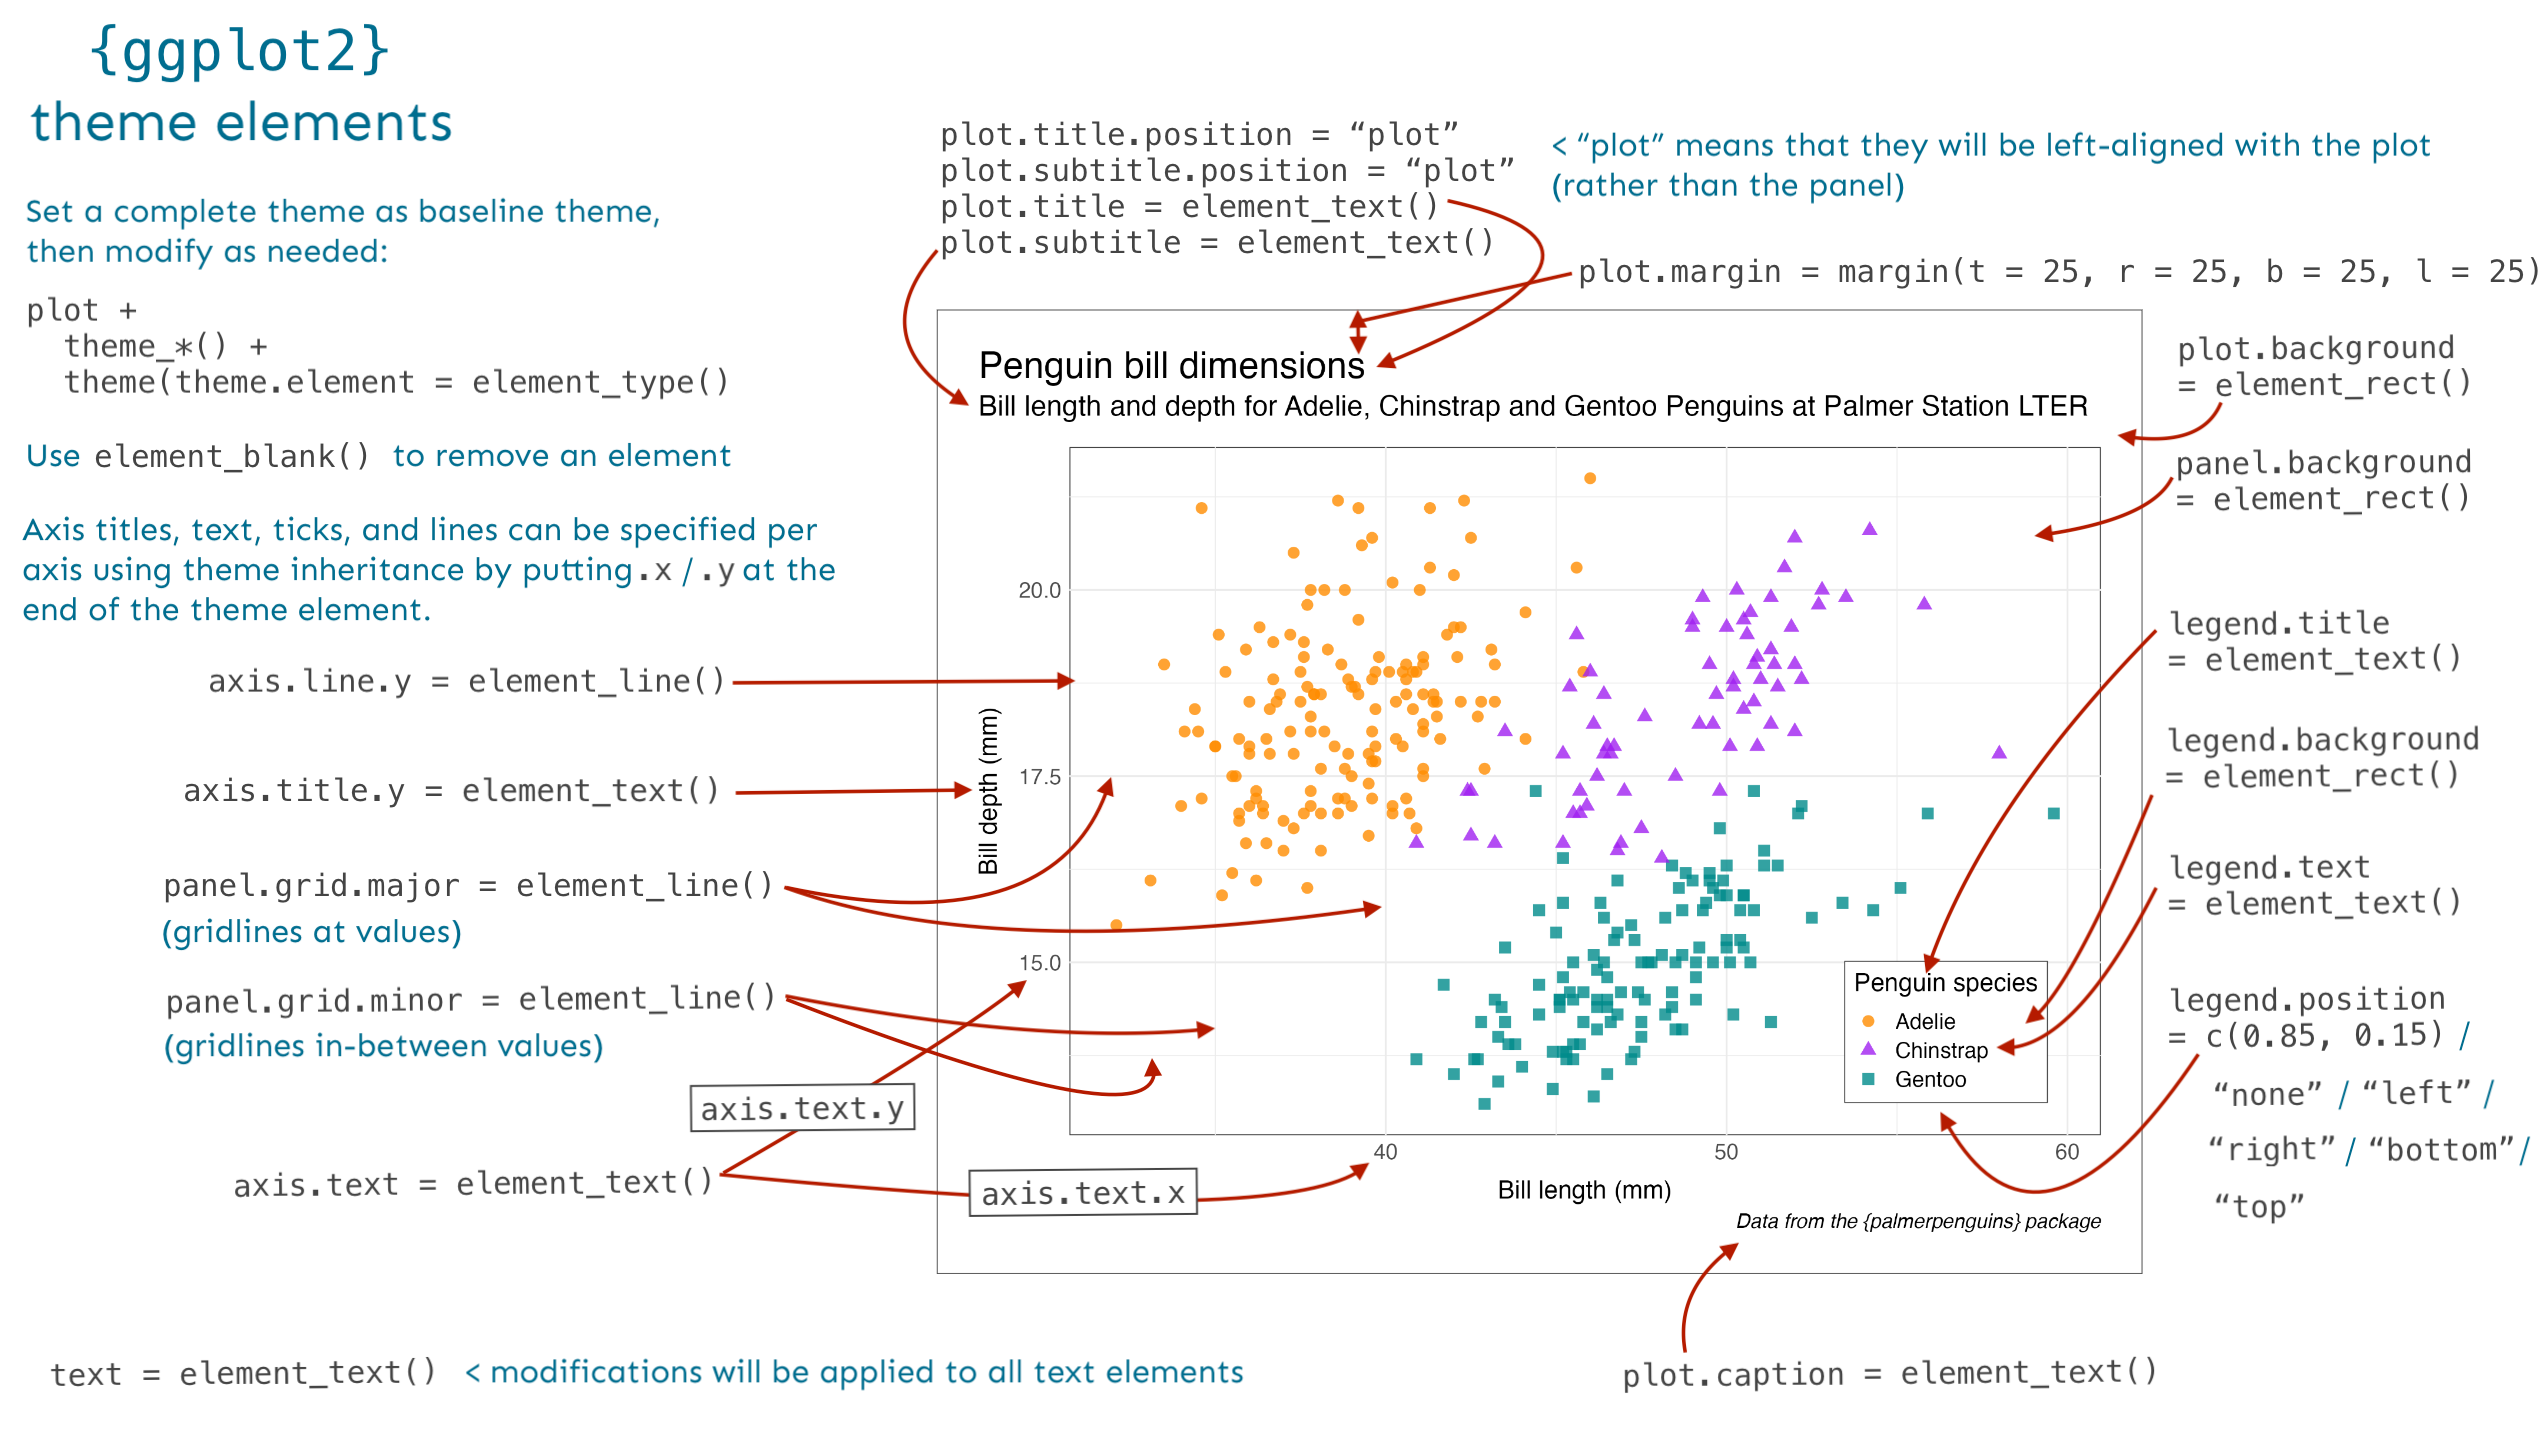
Themes are used to modify the non-data components of plots (e.g. titles, labels, fonts, background, gridlines, legend).


In addition to using pre-built themes (available via the {ggplot2} package and also from extension packages), you can fine-tune the appearance of your plots theme by making adjustments using the theme() function.

Pre-built themes


{ggplot2} comes with eight complete themes, which can be applied as-is, or further modified using theme(). There are also many additional themes which can be applied via ggplot extension packages. A small handful of packages with additional themes:

Keep an eye out for plot-specific themes


Keep your eye out for extension packages that supply both a geom(s) and a pre-build theme(s) designed specifically to work with that geom. For example, the {ggridges} package provides both a few different ridgeline plot geoms and a pre-built theme_ridges() theme to pair with them:


Use ggplot2::theme() for fine-tune control


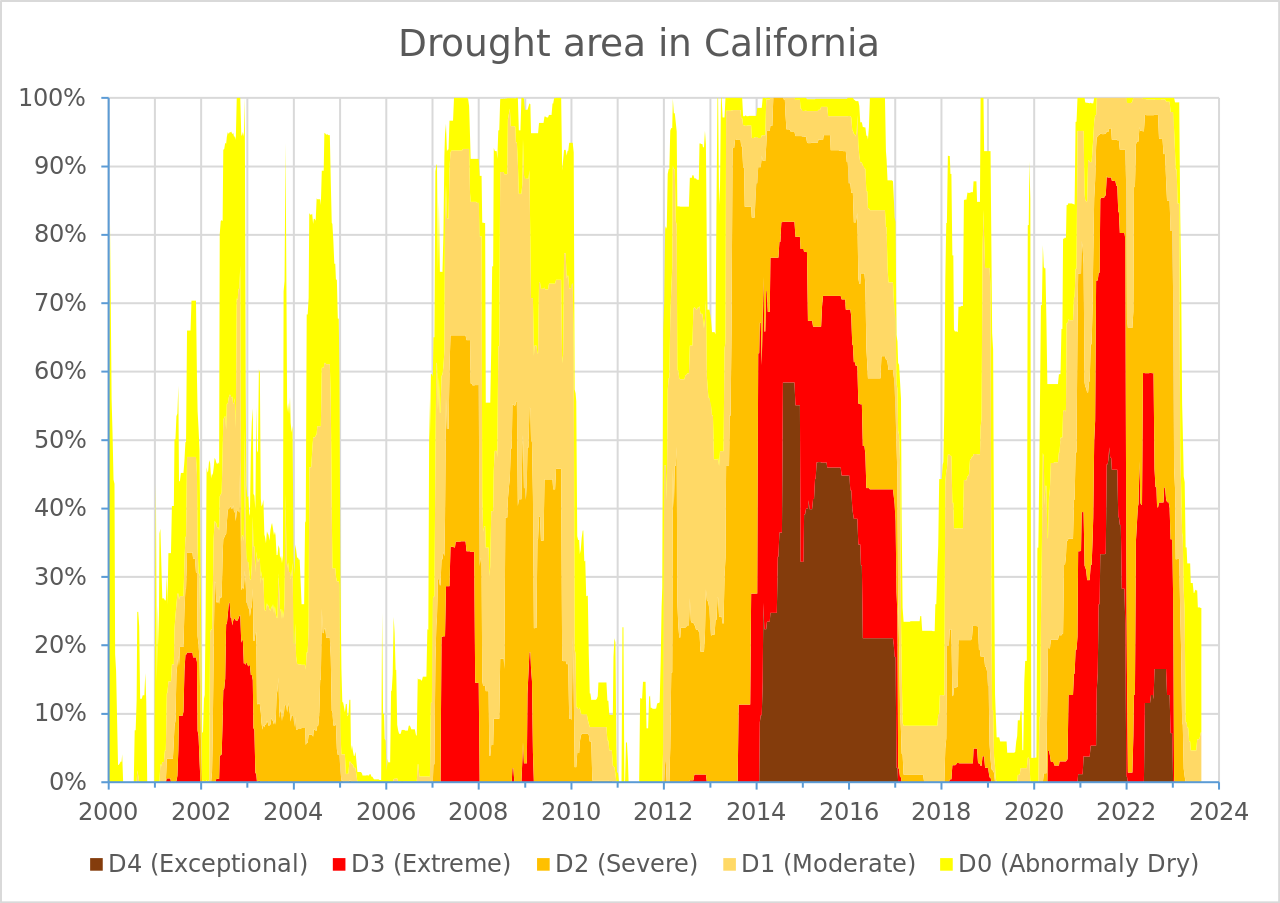
Recreate this USDM plot


Reference the graphic on the previous slide (and of course, documentation – run ?theme or check out online documentation) to start tweaking plot elements until it matches the original USDM graphic (below). It’s common to start with a pre-built theme and modify from there.