Artwork by Allison Horst
EDS 240: Lab 1
Data Wrangling
Week 1 | January 8th, 2026
What do we mean by “data wrangling?”
“Data wrangling, sometimes referred to as data munging, is the process of transforming and mapping data from one ”raw” data form into another format with the intent of making it more appropriate and valuable for a variety of downstream purposes such as analytics.”
Wrangling includes (but is not limited to):
- data cleaning (e.g. handling missing values, consistent naming of observations, ensuring variables are the correct data types, etc.)
- restructuring data (e.g. tidying data (i.e. convert from wide > long format))
- combining data sets (e.g. using key values to merge two related data sets)
Wrangling is a critical first step in building any sort of data visualization!
You may have heard something like, “Data scientists spend 80% of their time preparing their data for analysis and / or visualization.” And while that may not be totally accurate for all data scientists or all projects, you will spend lots of time wrestling with data.
{ggplot2} plays best with tidy data
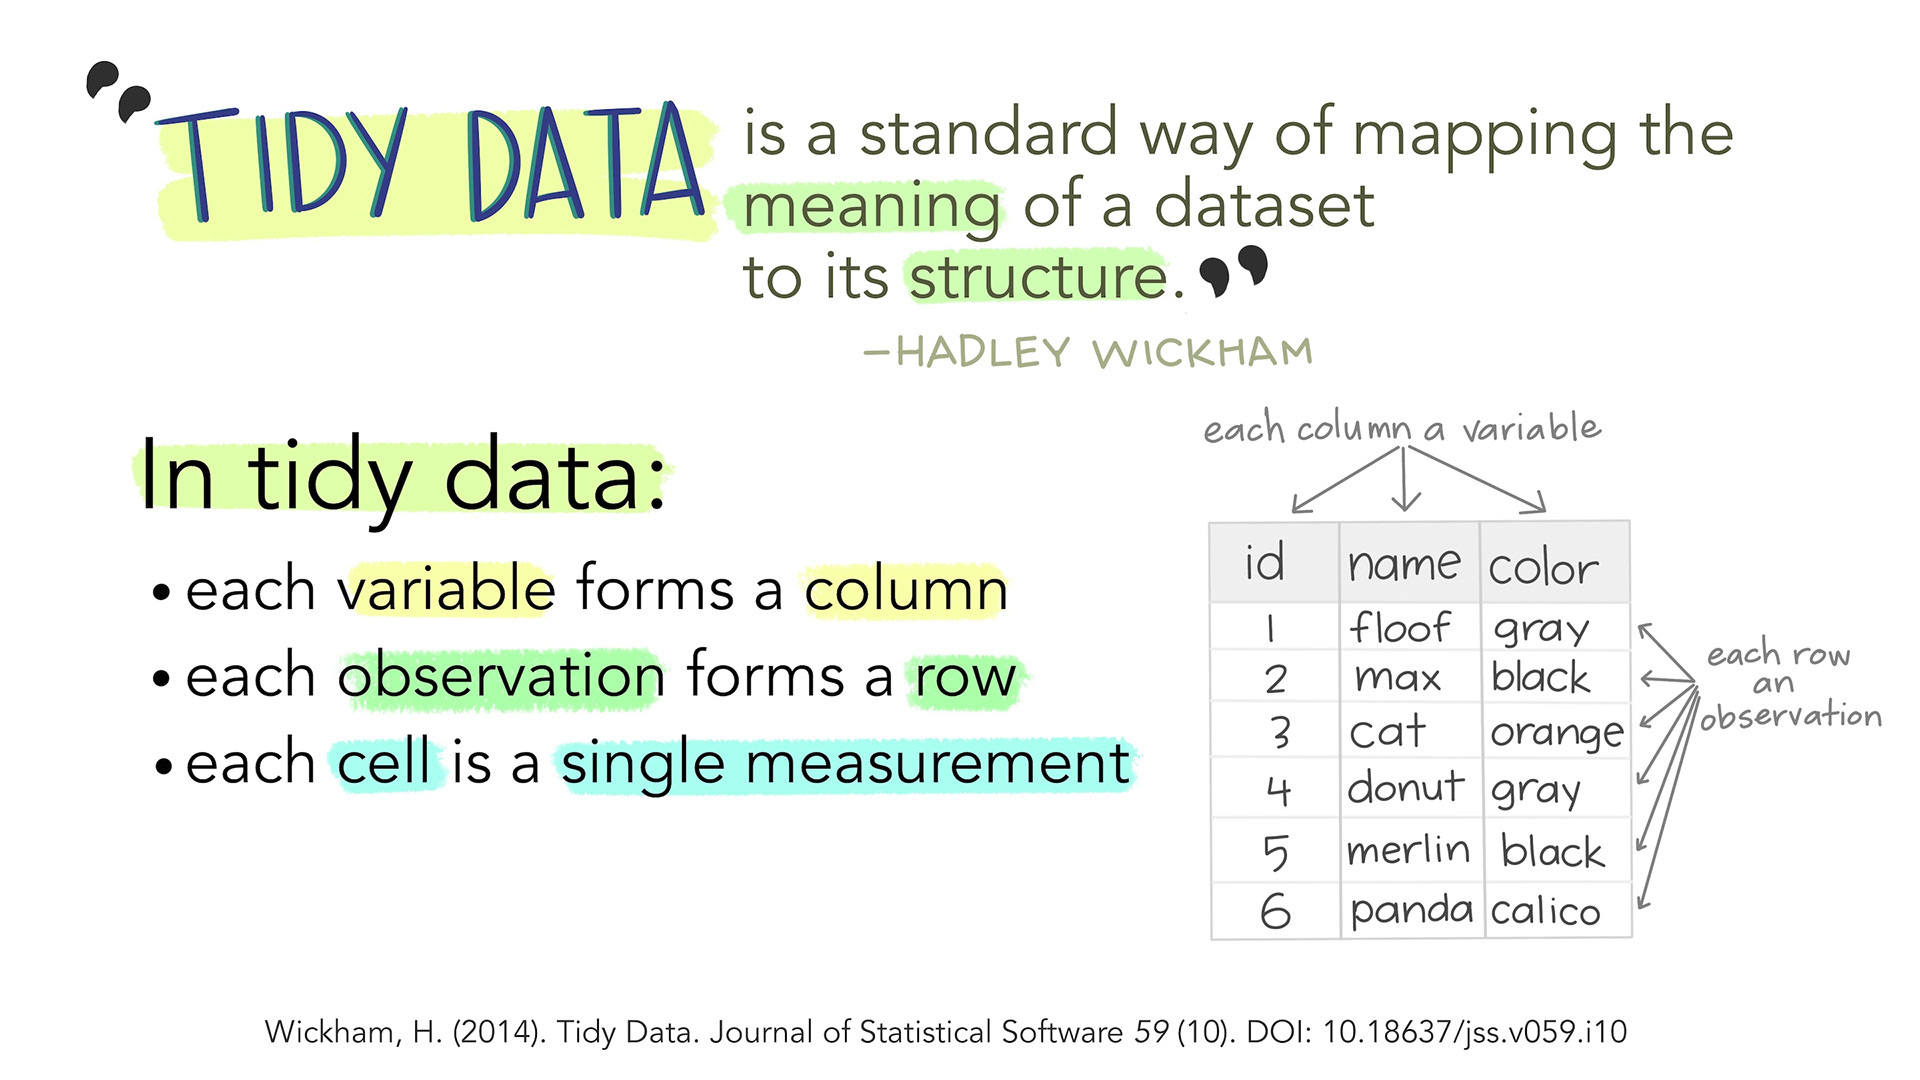
Reminder: tidy data is not a {ggplot2}-specific concept. It’s a broadly standardized way of organizing data.
The {tidyverse} provides lots of helpful tools
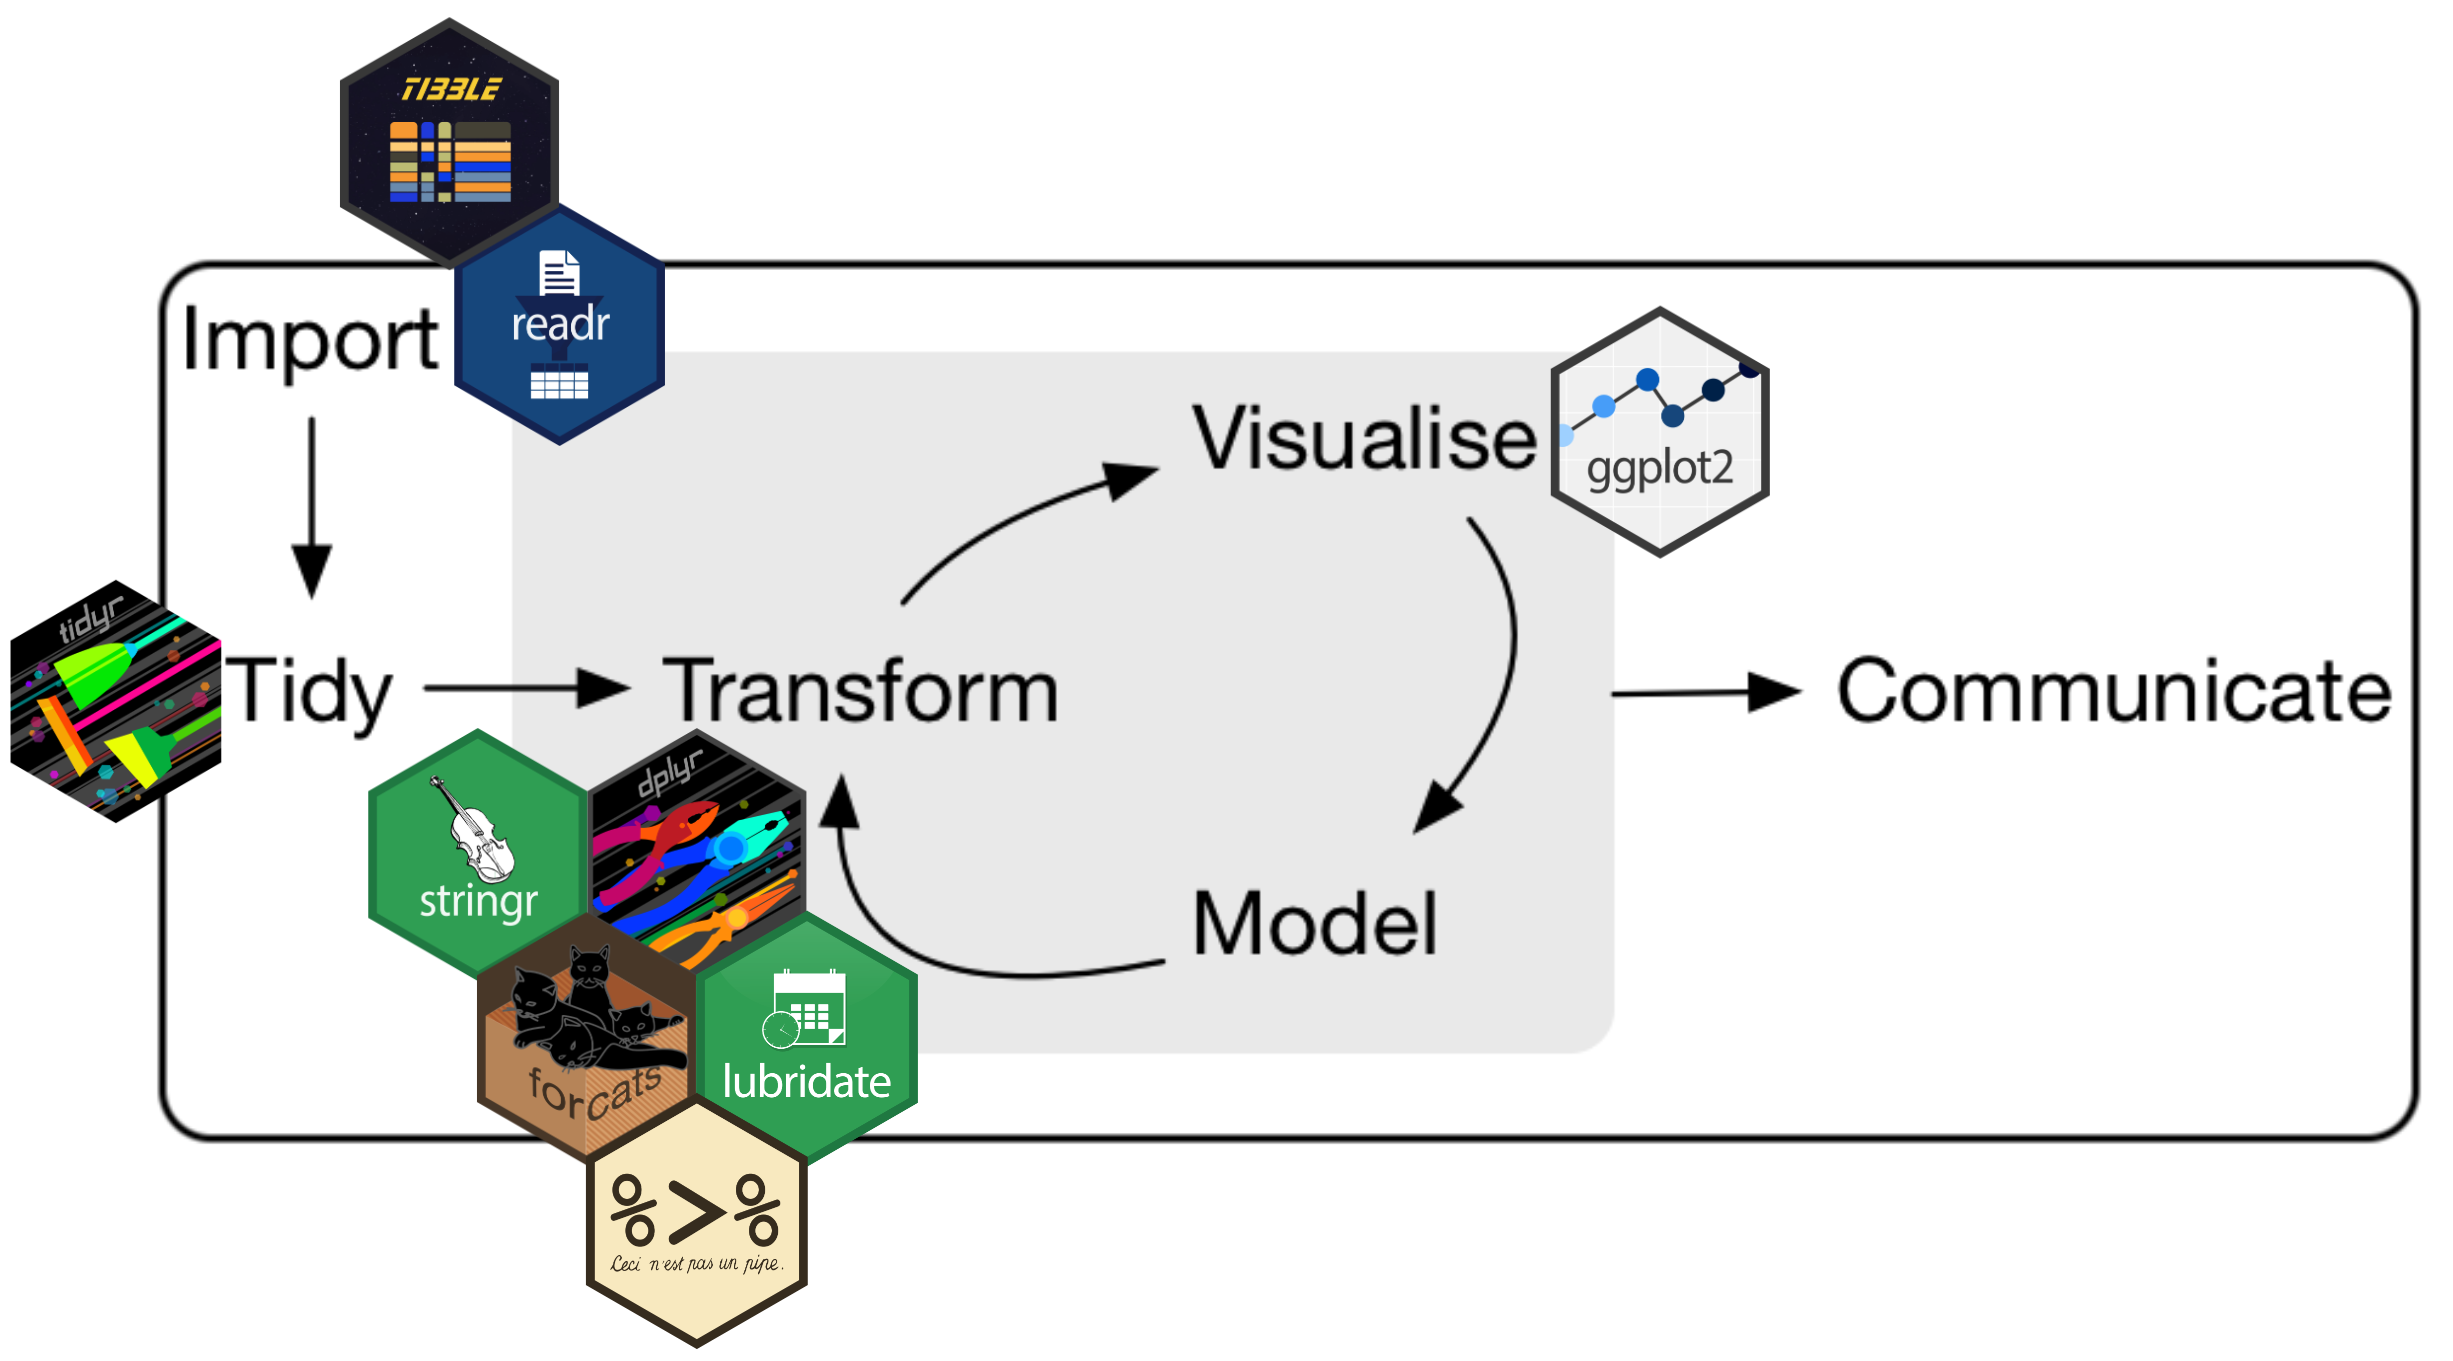
The data science workflow, as described by Hadley Wickham, Mine Çetinkaya-Rundel and Garrett Grolemund in R for Data Science (2e), with added {tidyverse} packages as they fit within this workflow.
Note that there are a number of other non-tidyverse packages that are also incredibly helpful too (e.g. {janitor}, {naniar})!
Let’s wrangle some bee stressor data
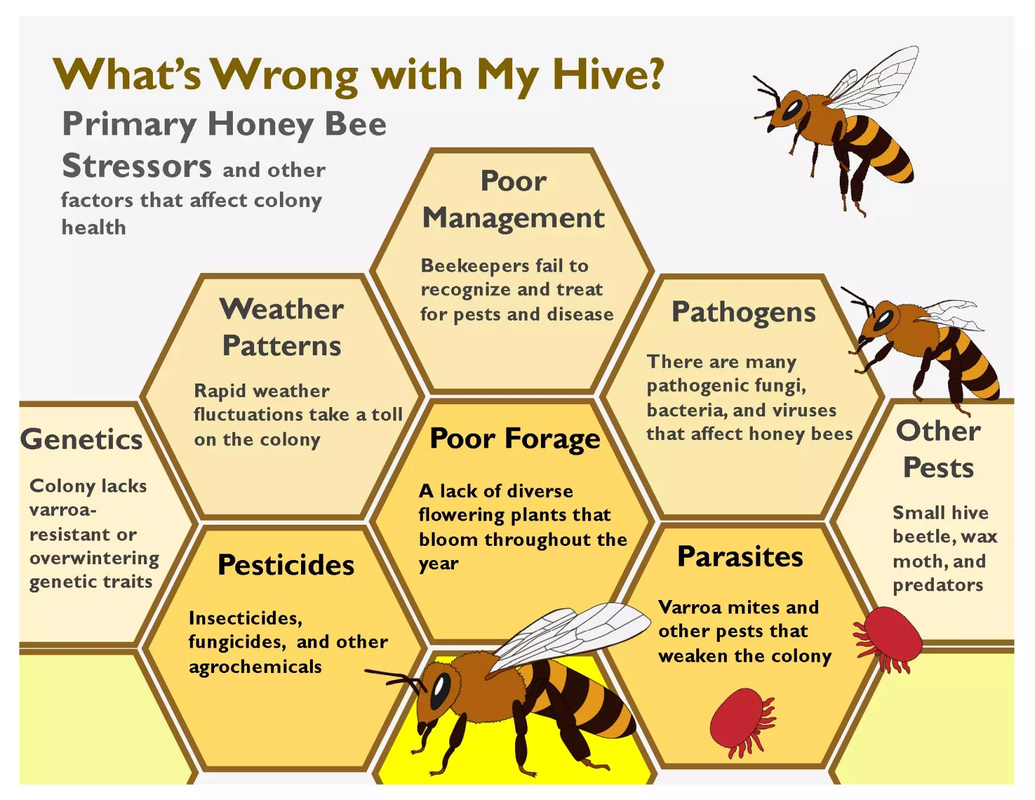
Source: Nebraska Public Media
Interested in learning more about bee colony loss rates and stressors? Check out this article from Penn State.
Download bee stressor data from Google Drive!
You should already have downloaded these data from Google Drive
This data is available in a yearly report from the USDA. TidyTuesday processed this data into a csv in 2021. To achieve the goal of practicing data wrangling in this lab, this data was messified using the messy package in R, along with some {tidyverse} functions.
Open up the Week 1 Lab: Exercise for instructions / next steps.