Choosing the right graphic form is just the first step! It’s important to consider how you can enhance your visualization by:
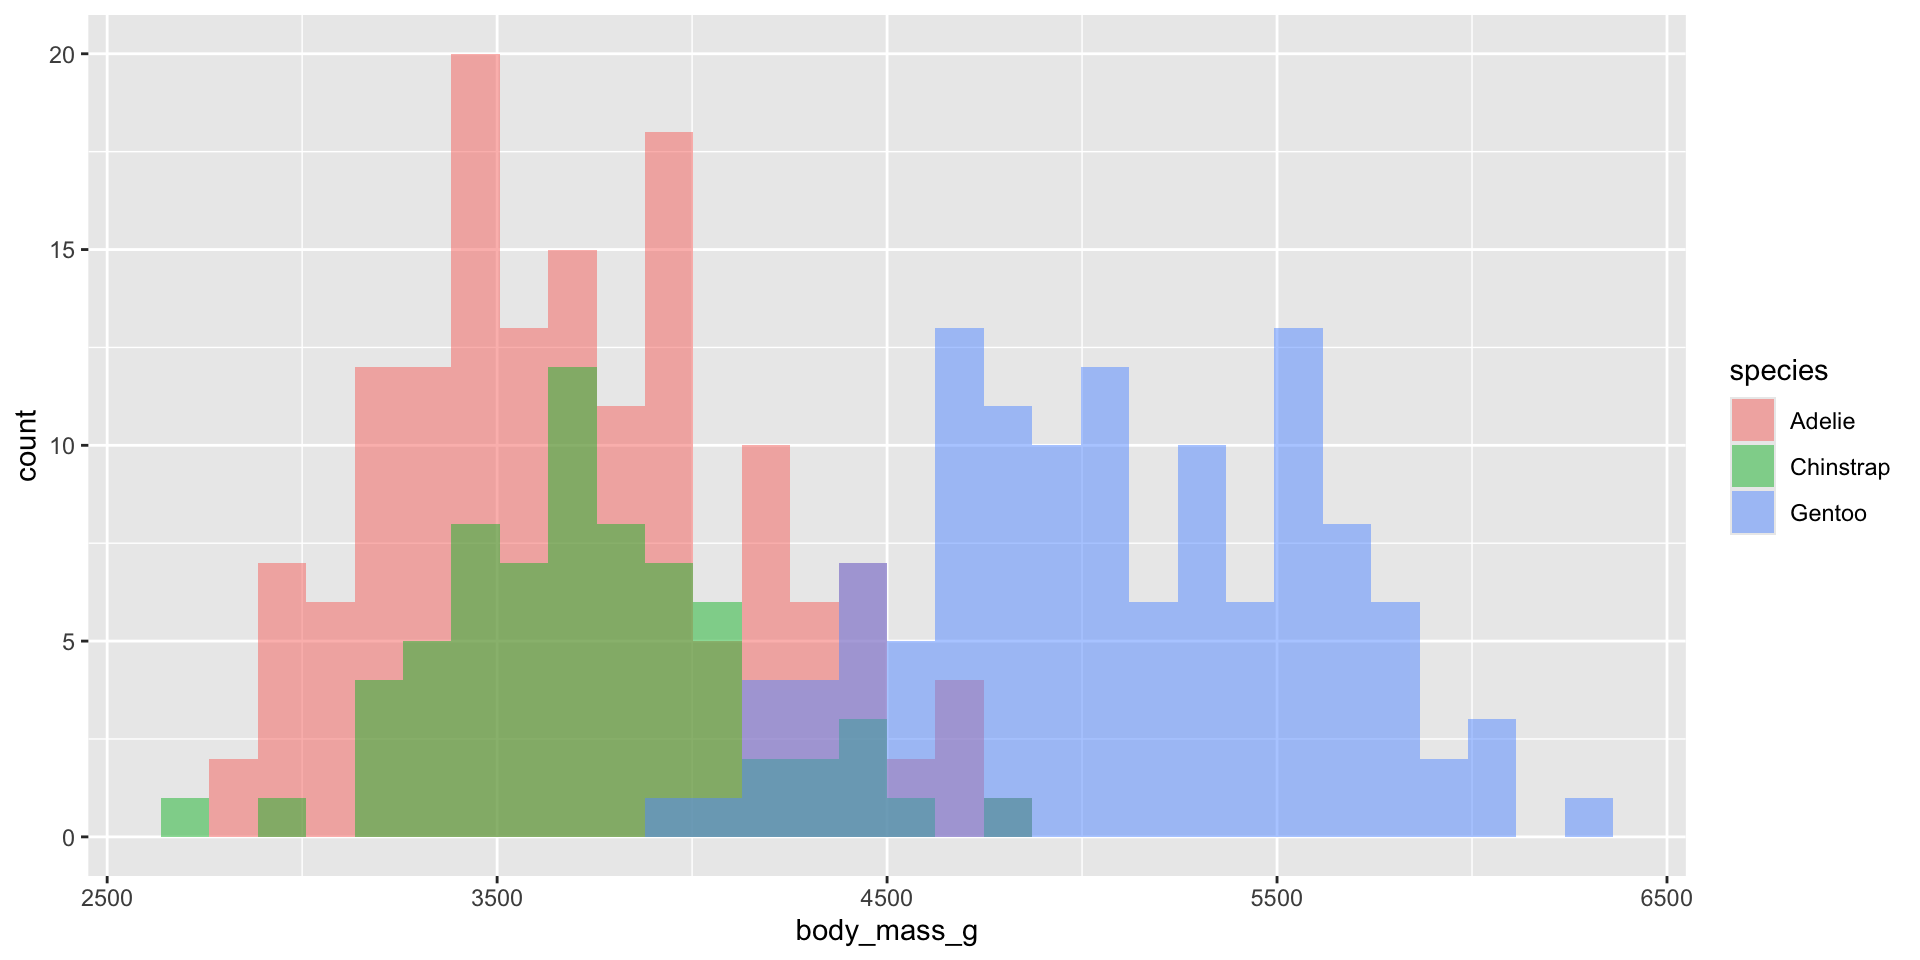
Histograms
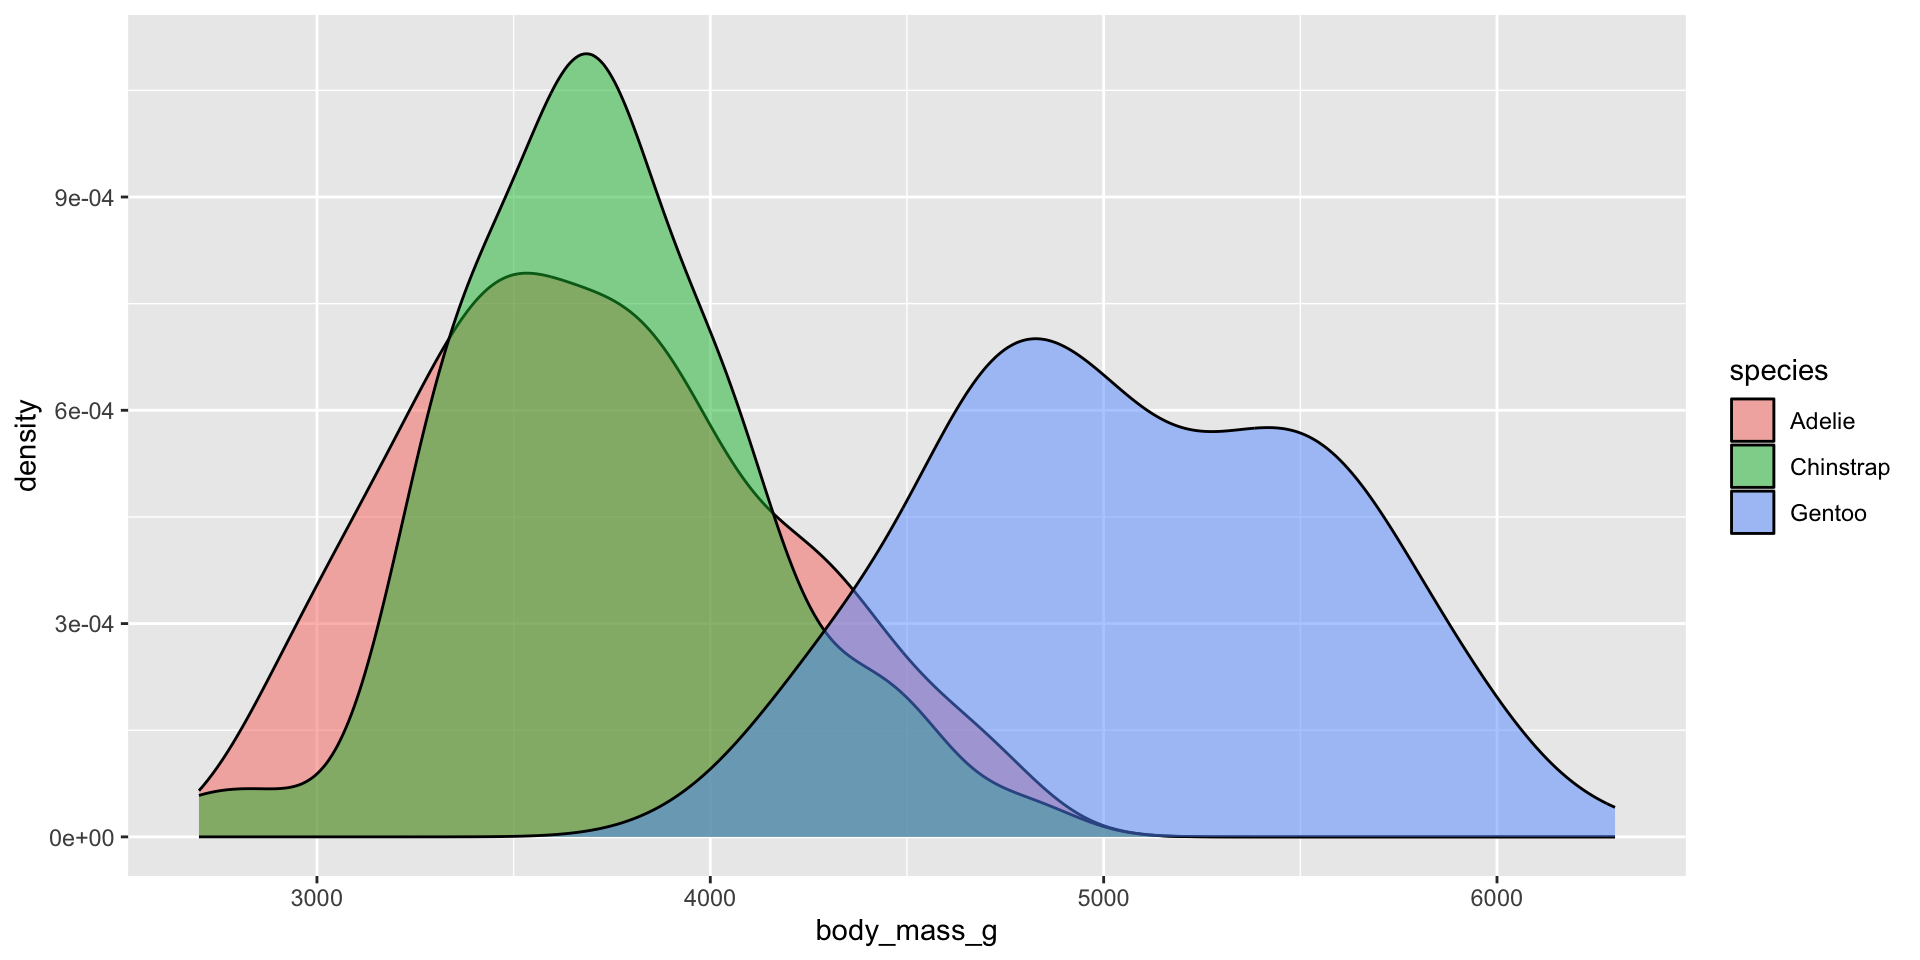
Density plots
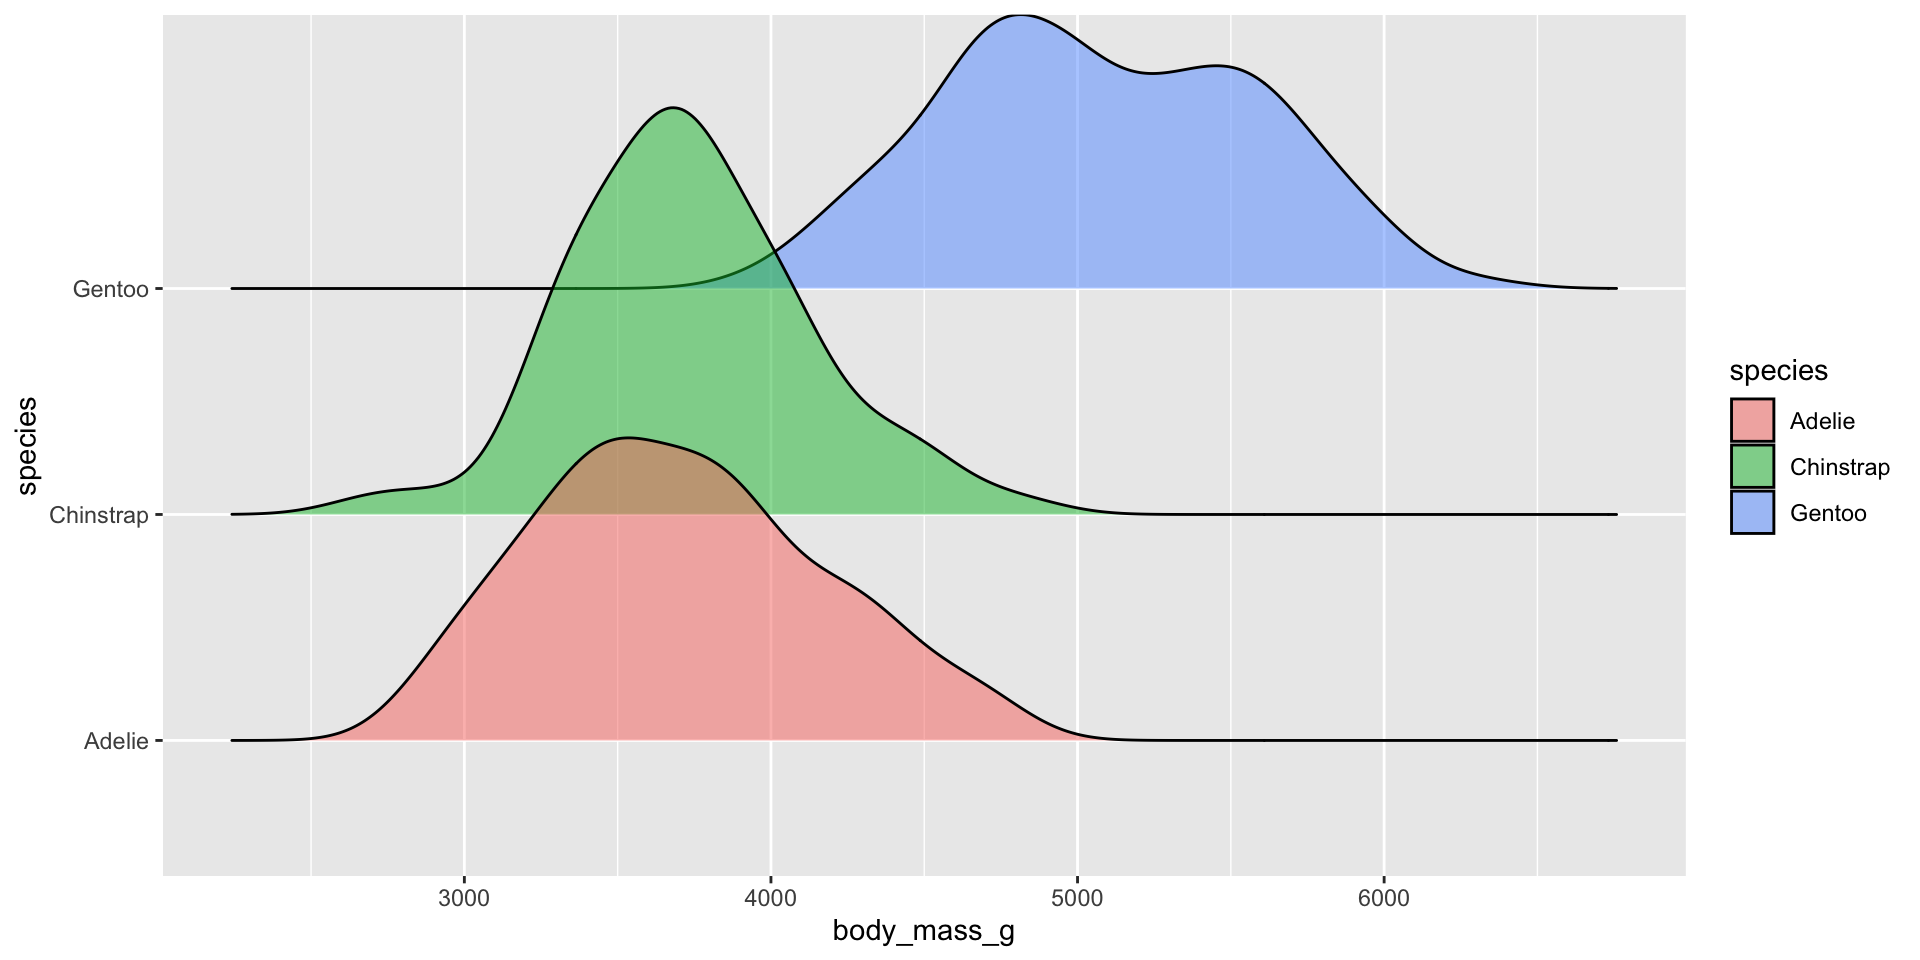
Ridgeline plots
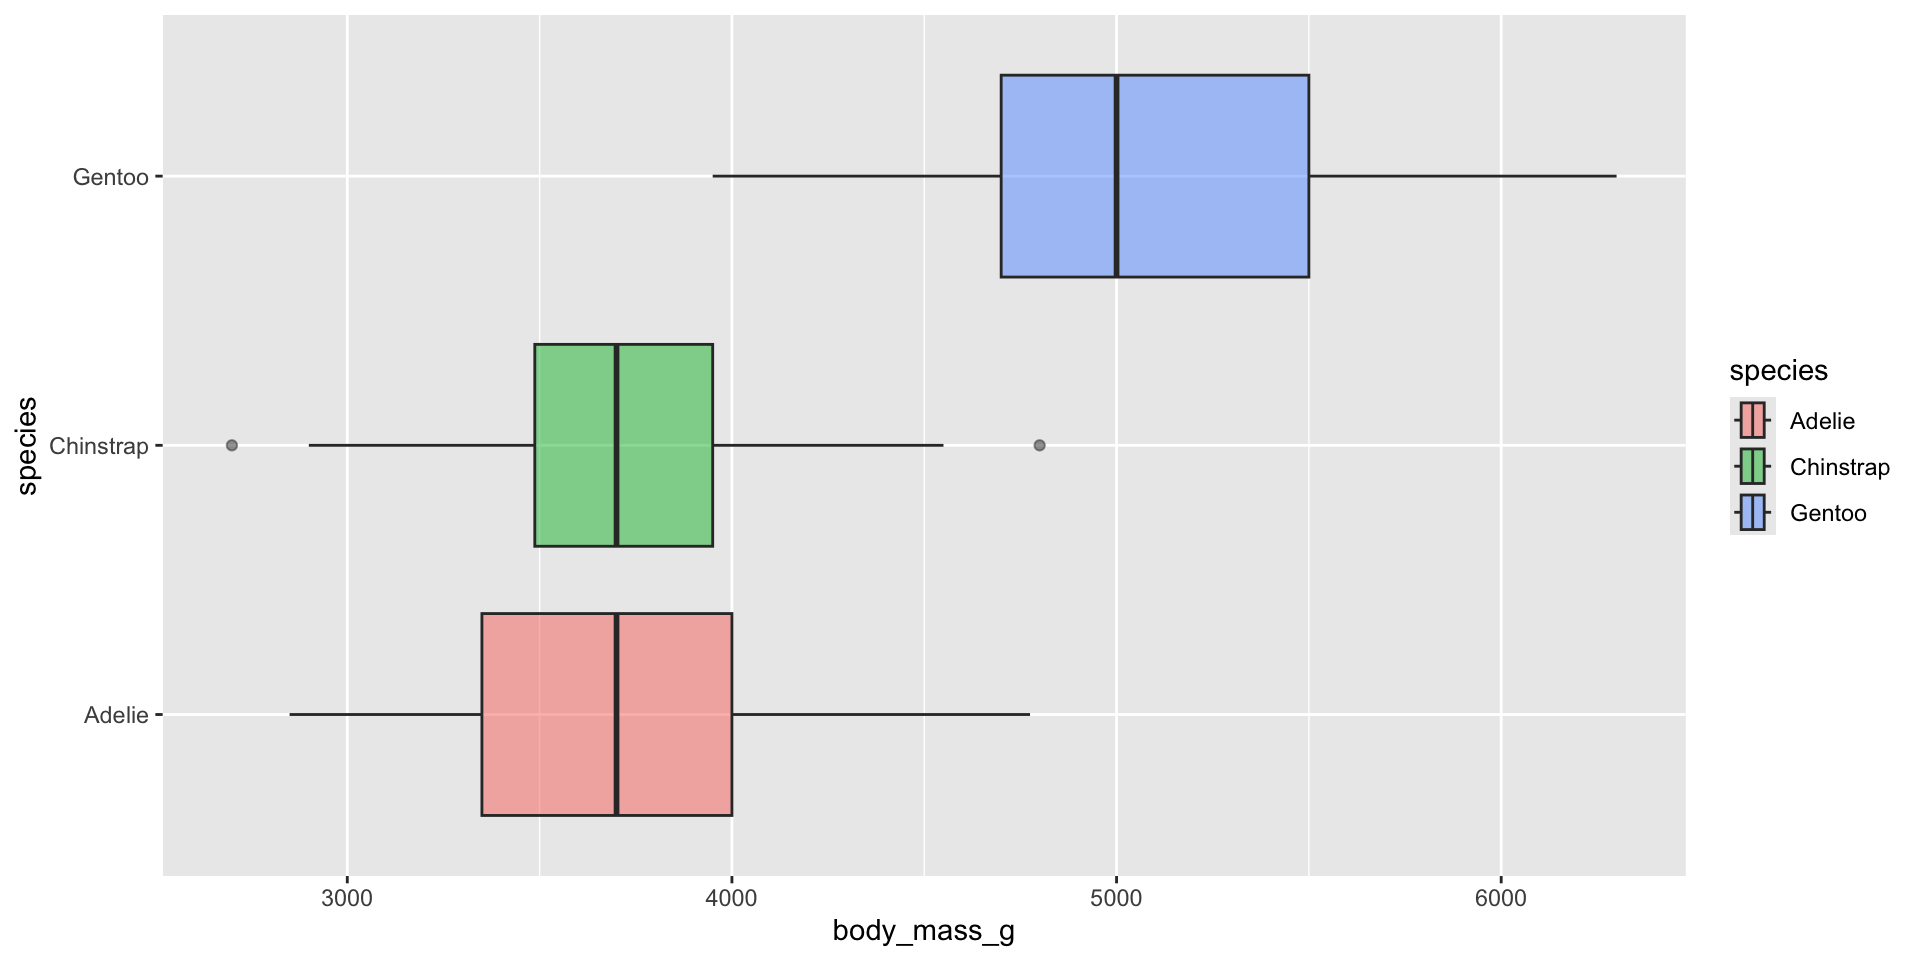
Box plots
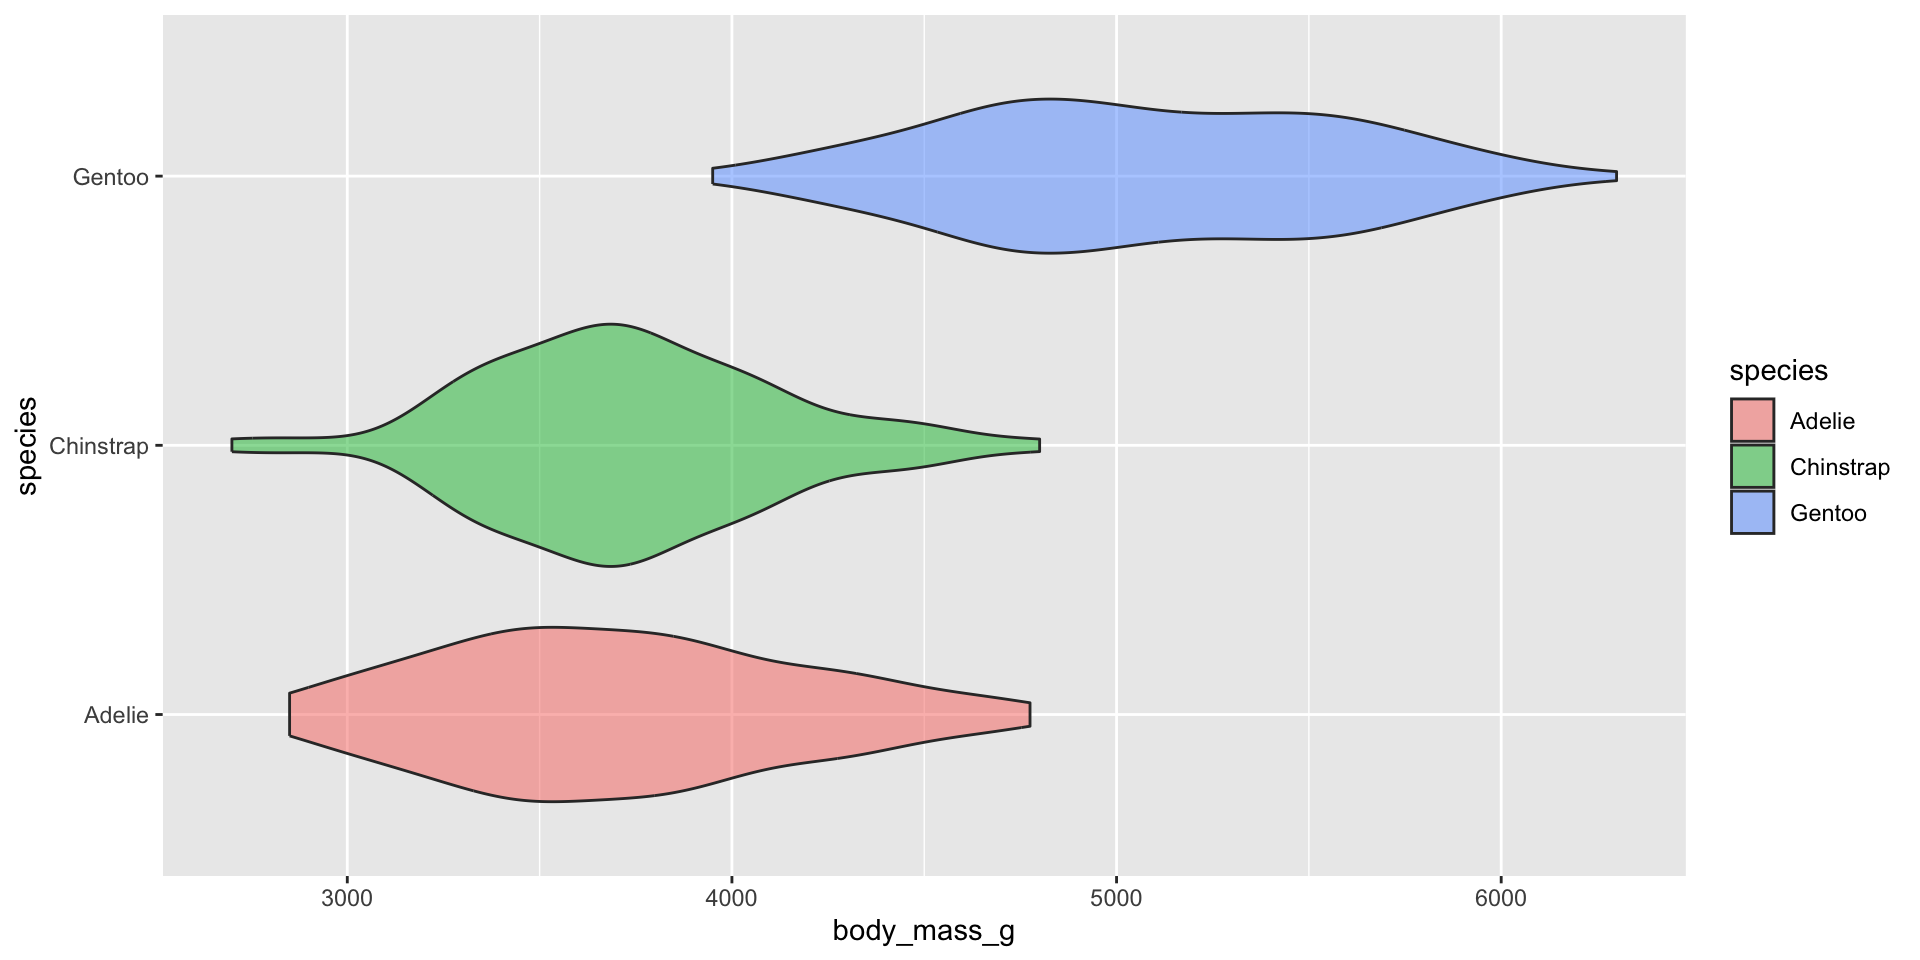
Violin plots
Bar Plots

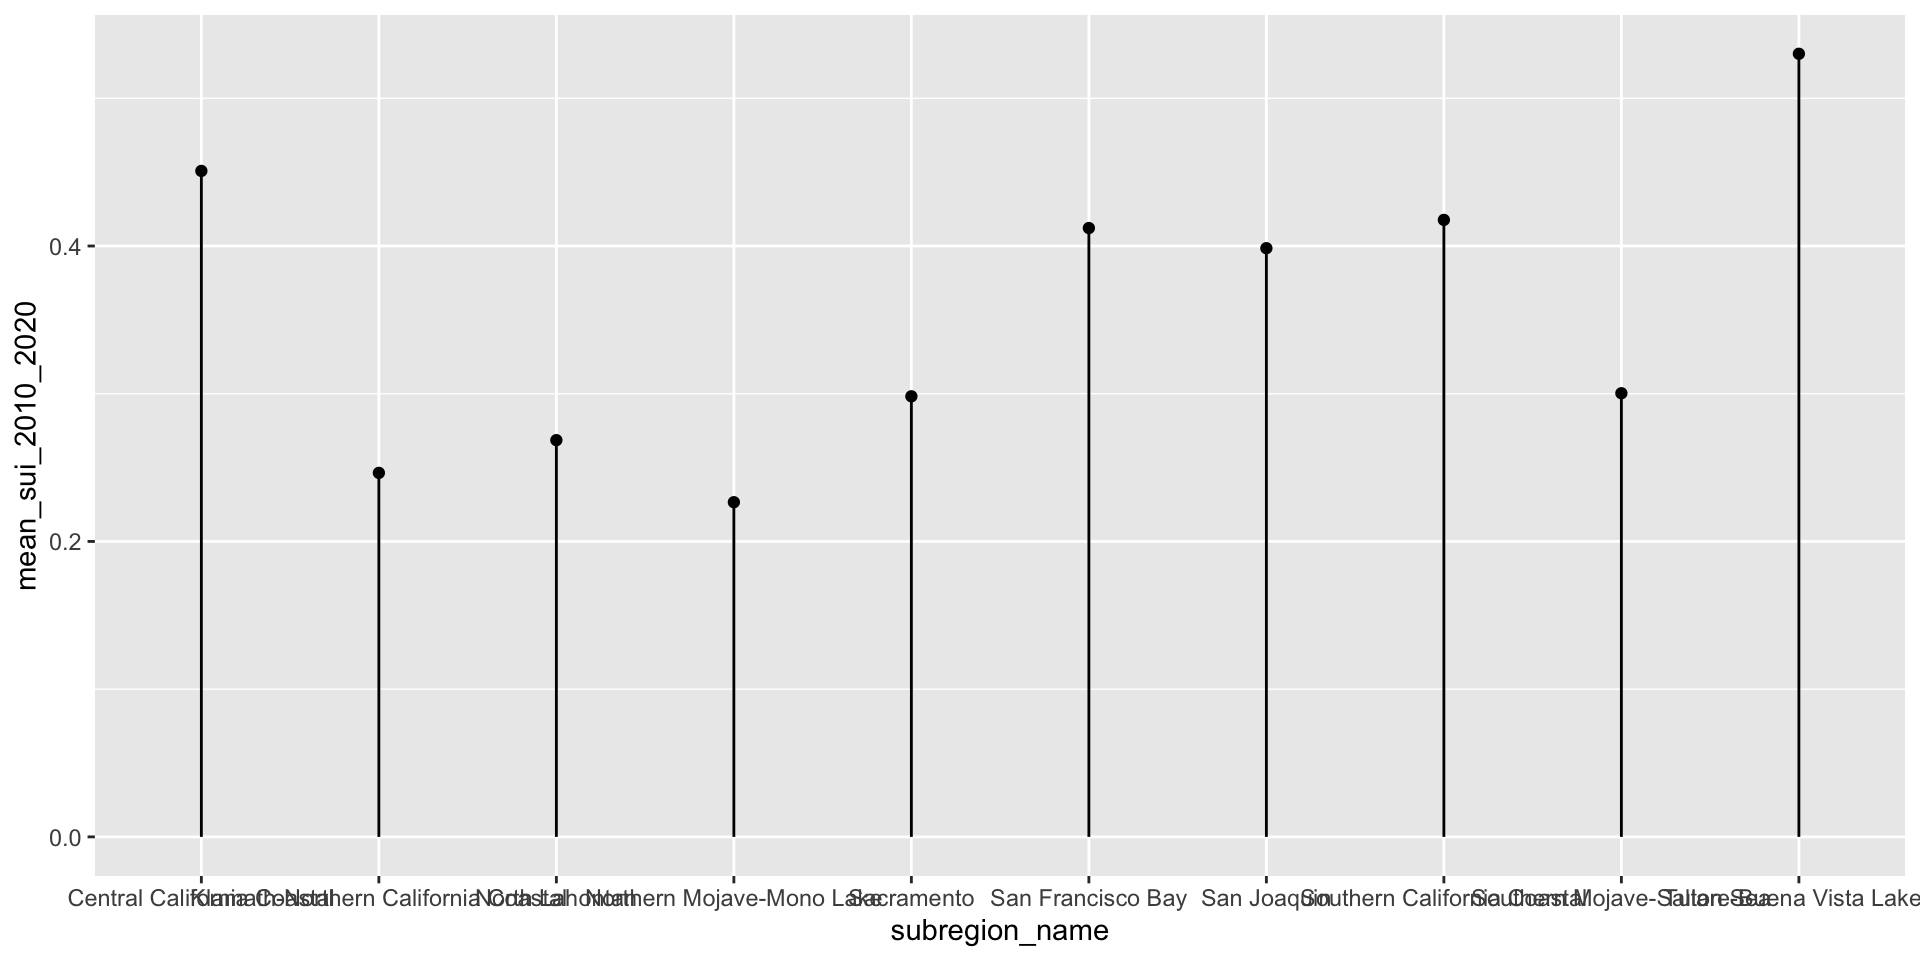
Lollipop Plots
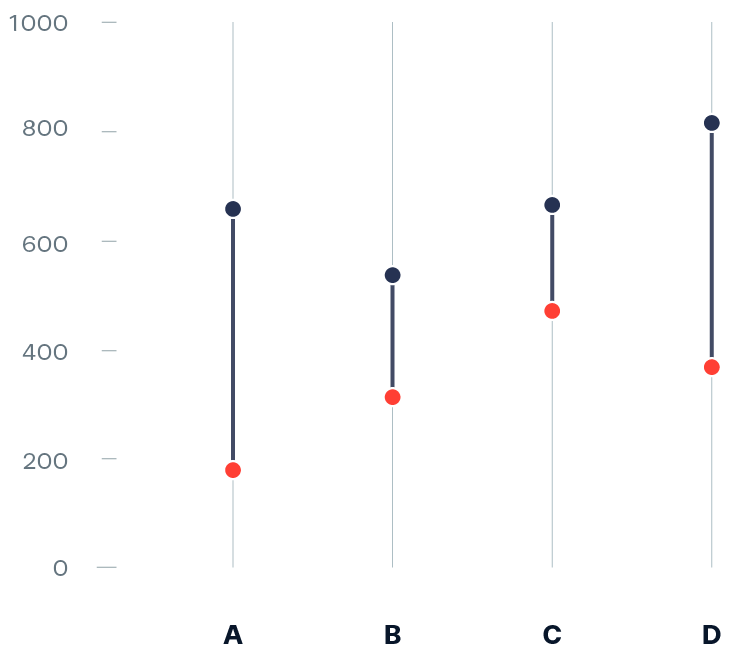
Dumbbell Plots
Considerations:
coord_flip)
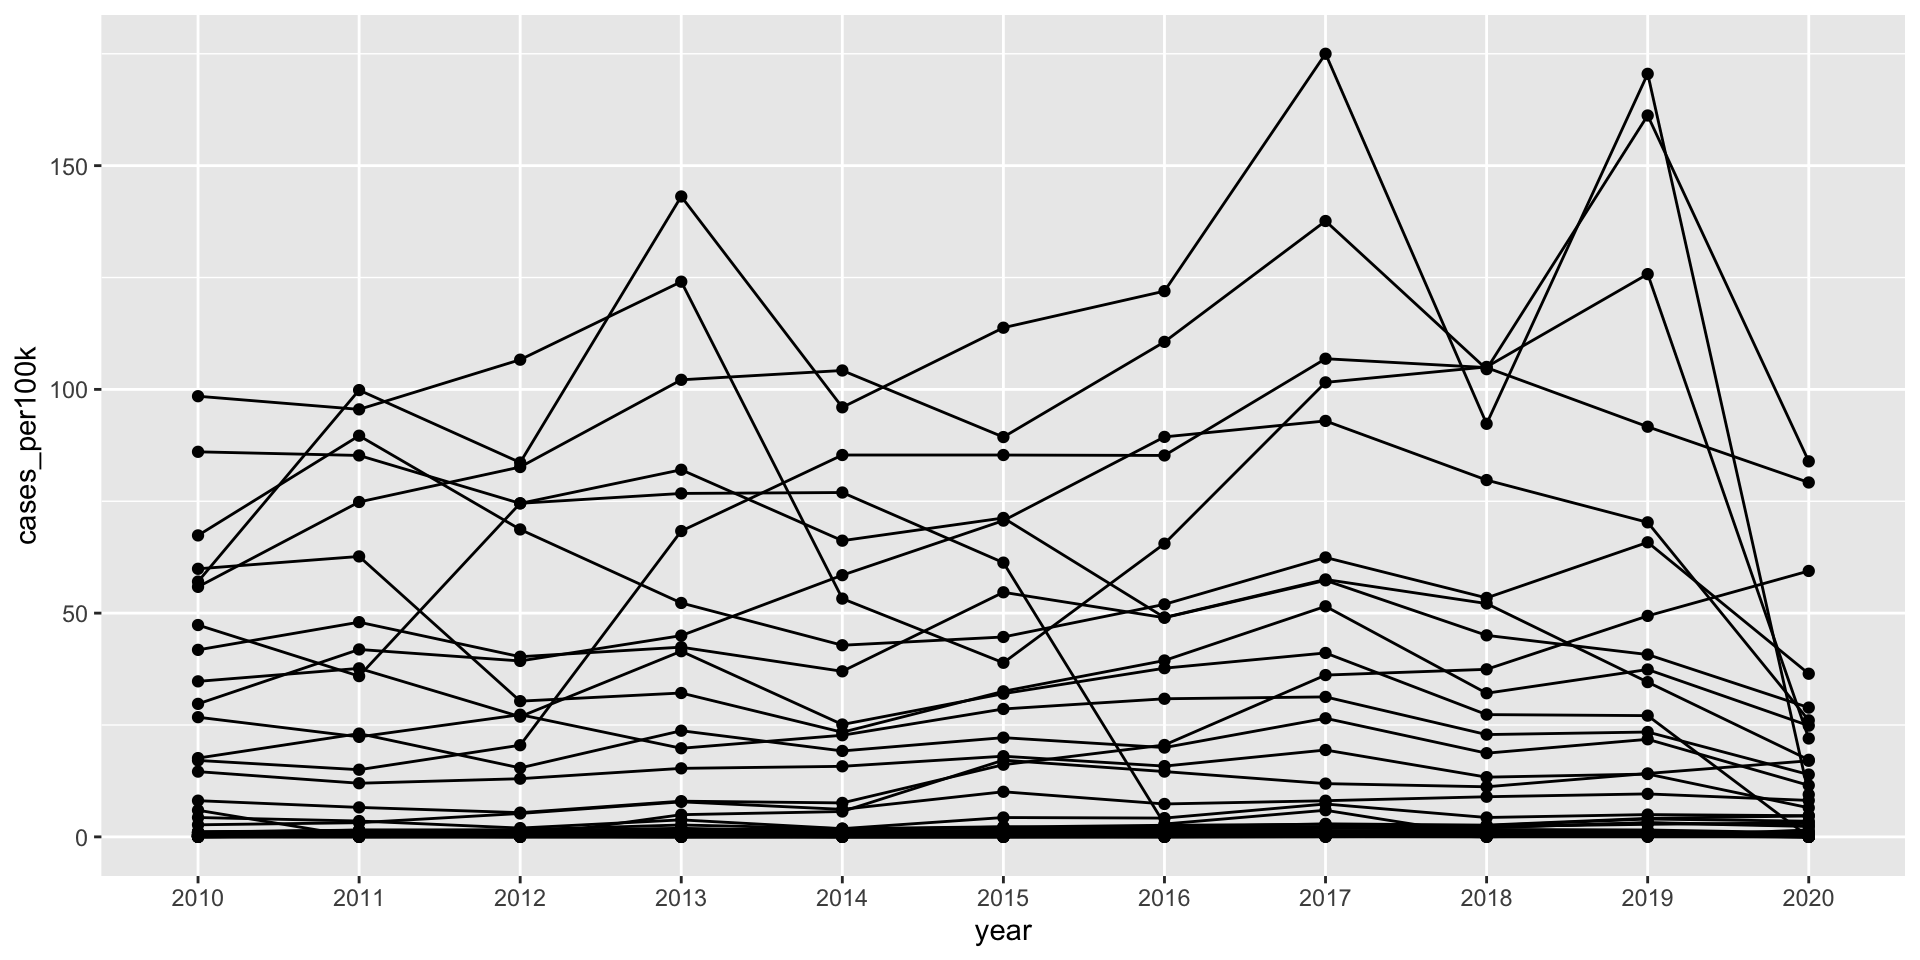
Line Charts
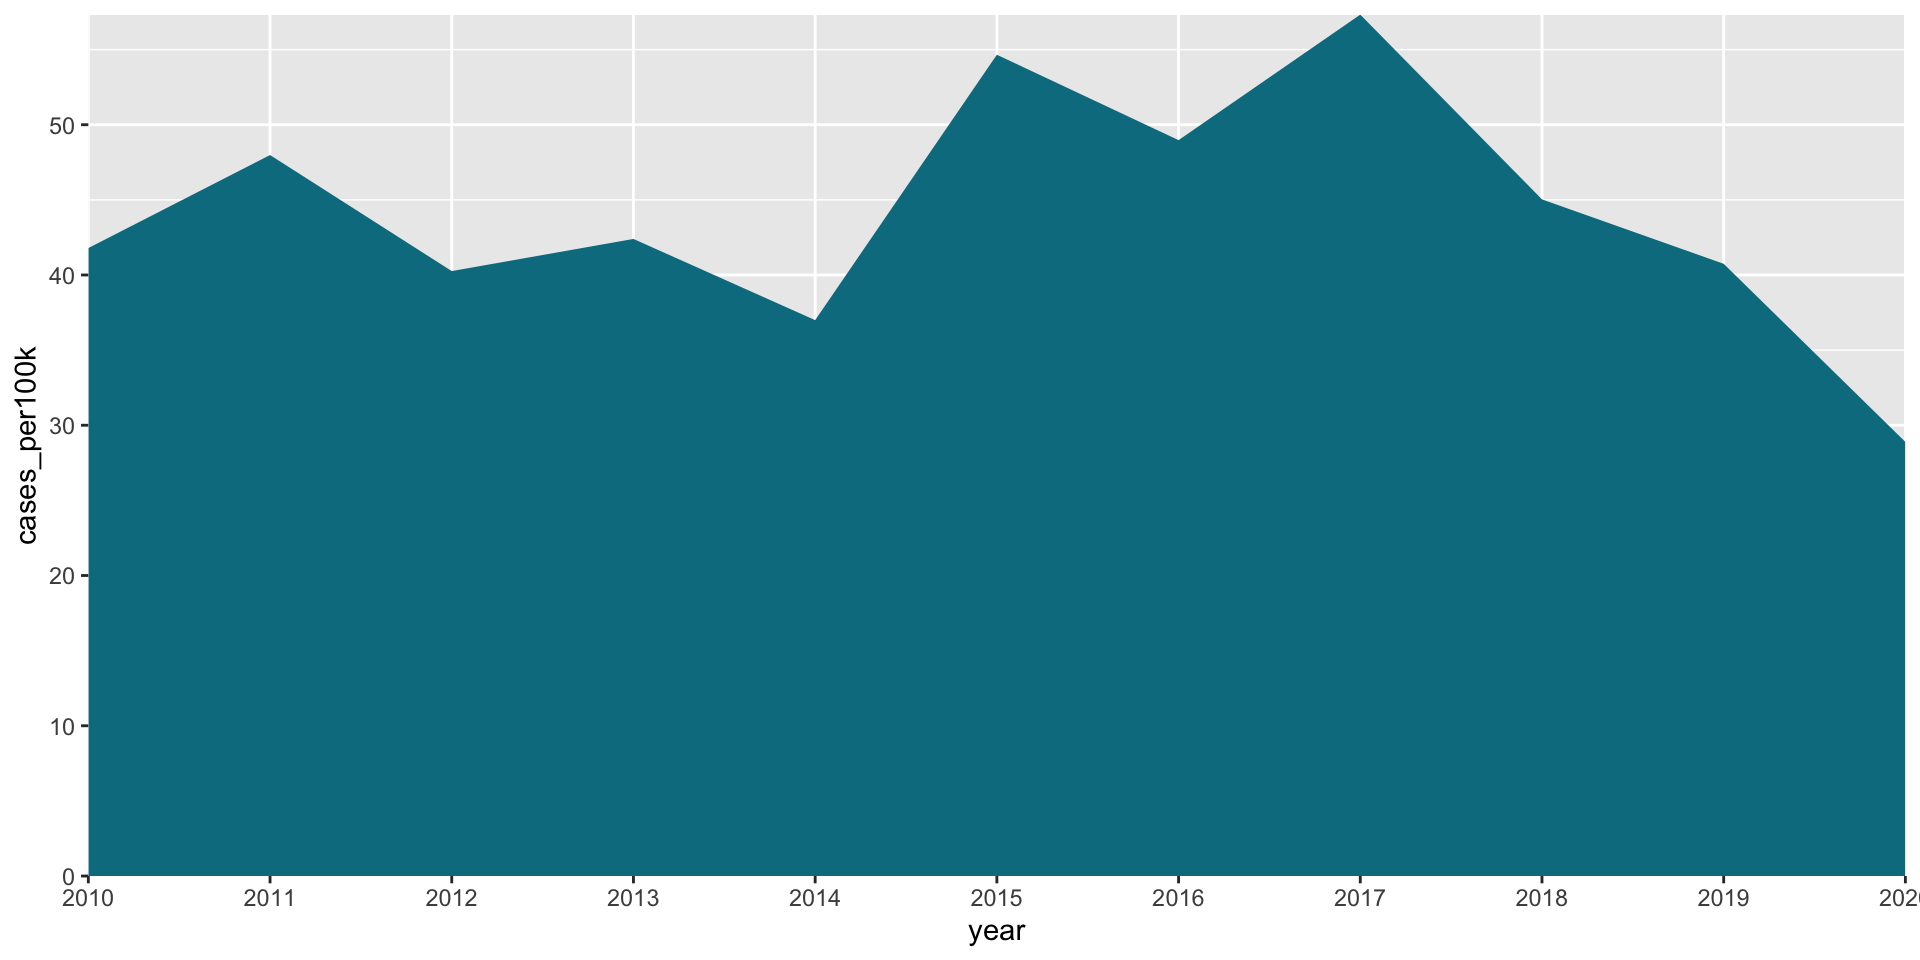
Area plots
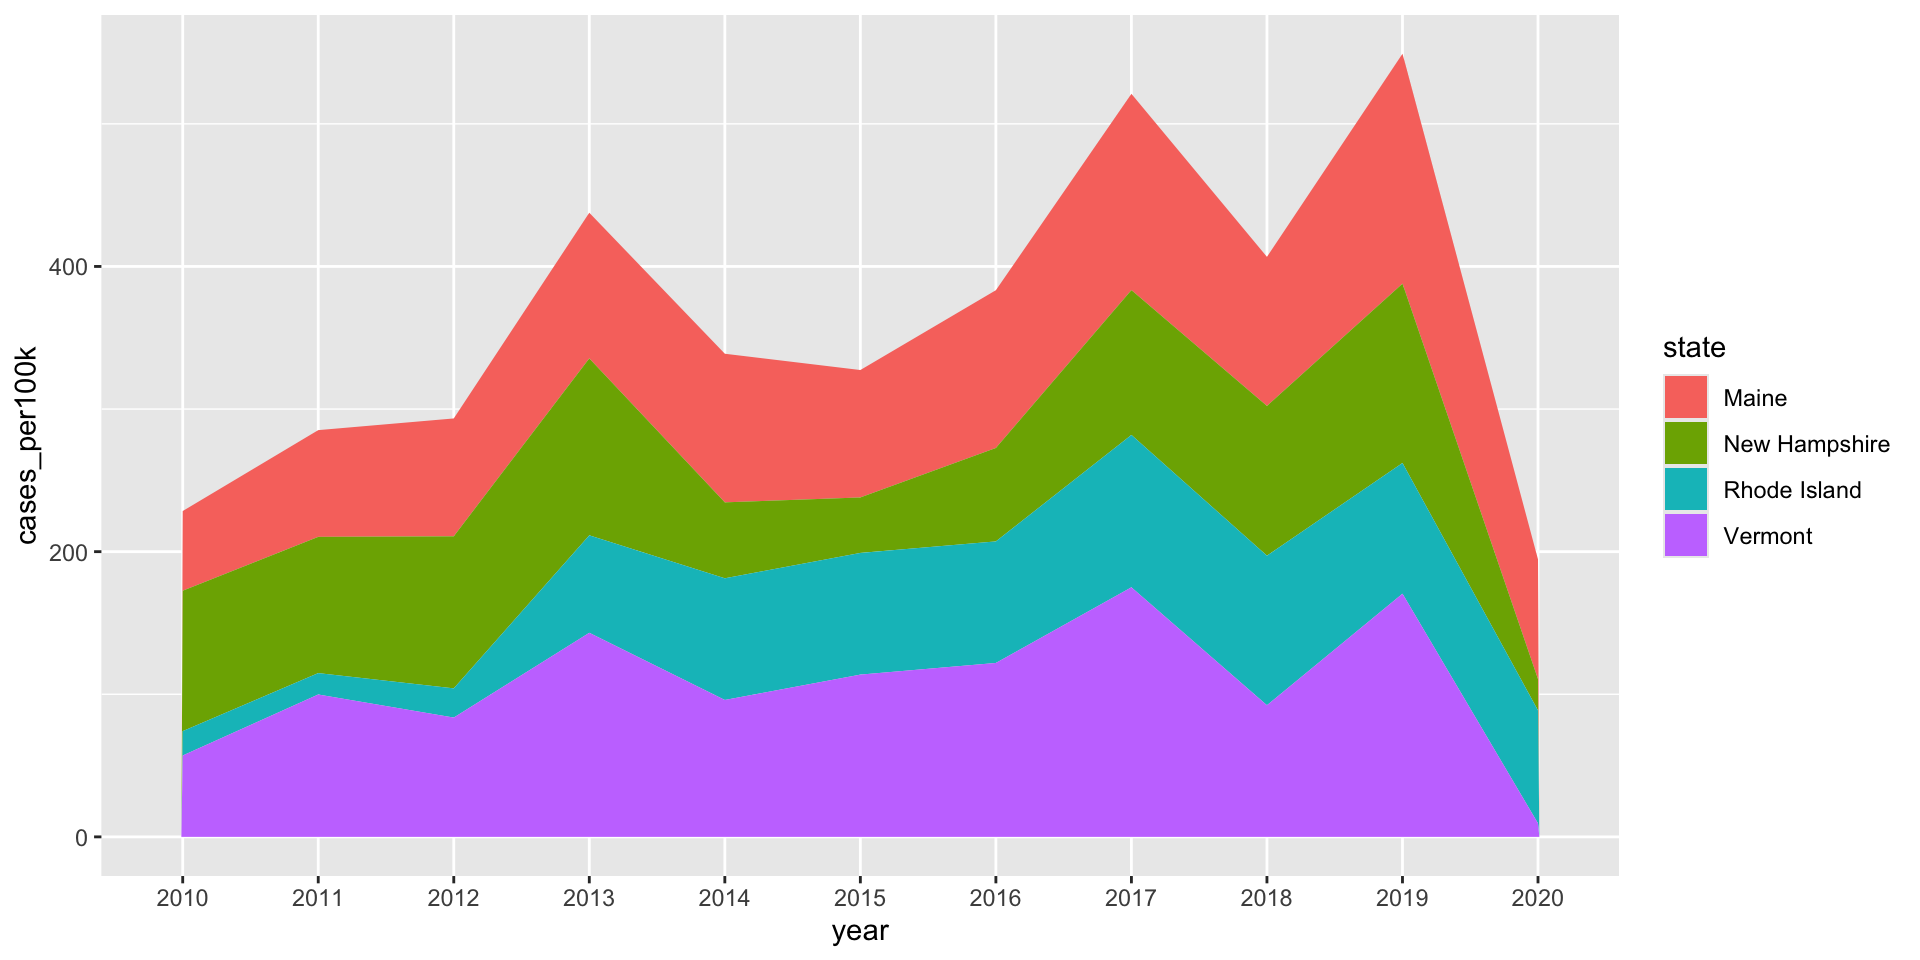
Stacked area plots
gghighlight()
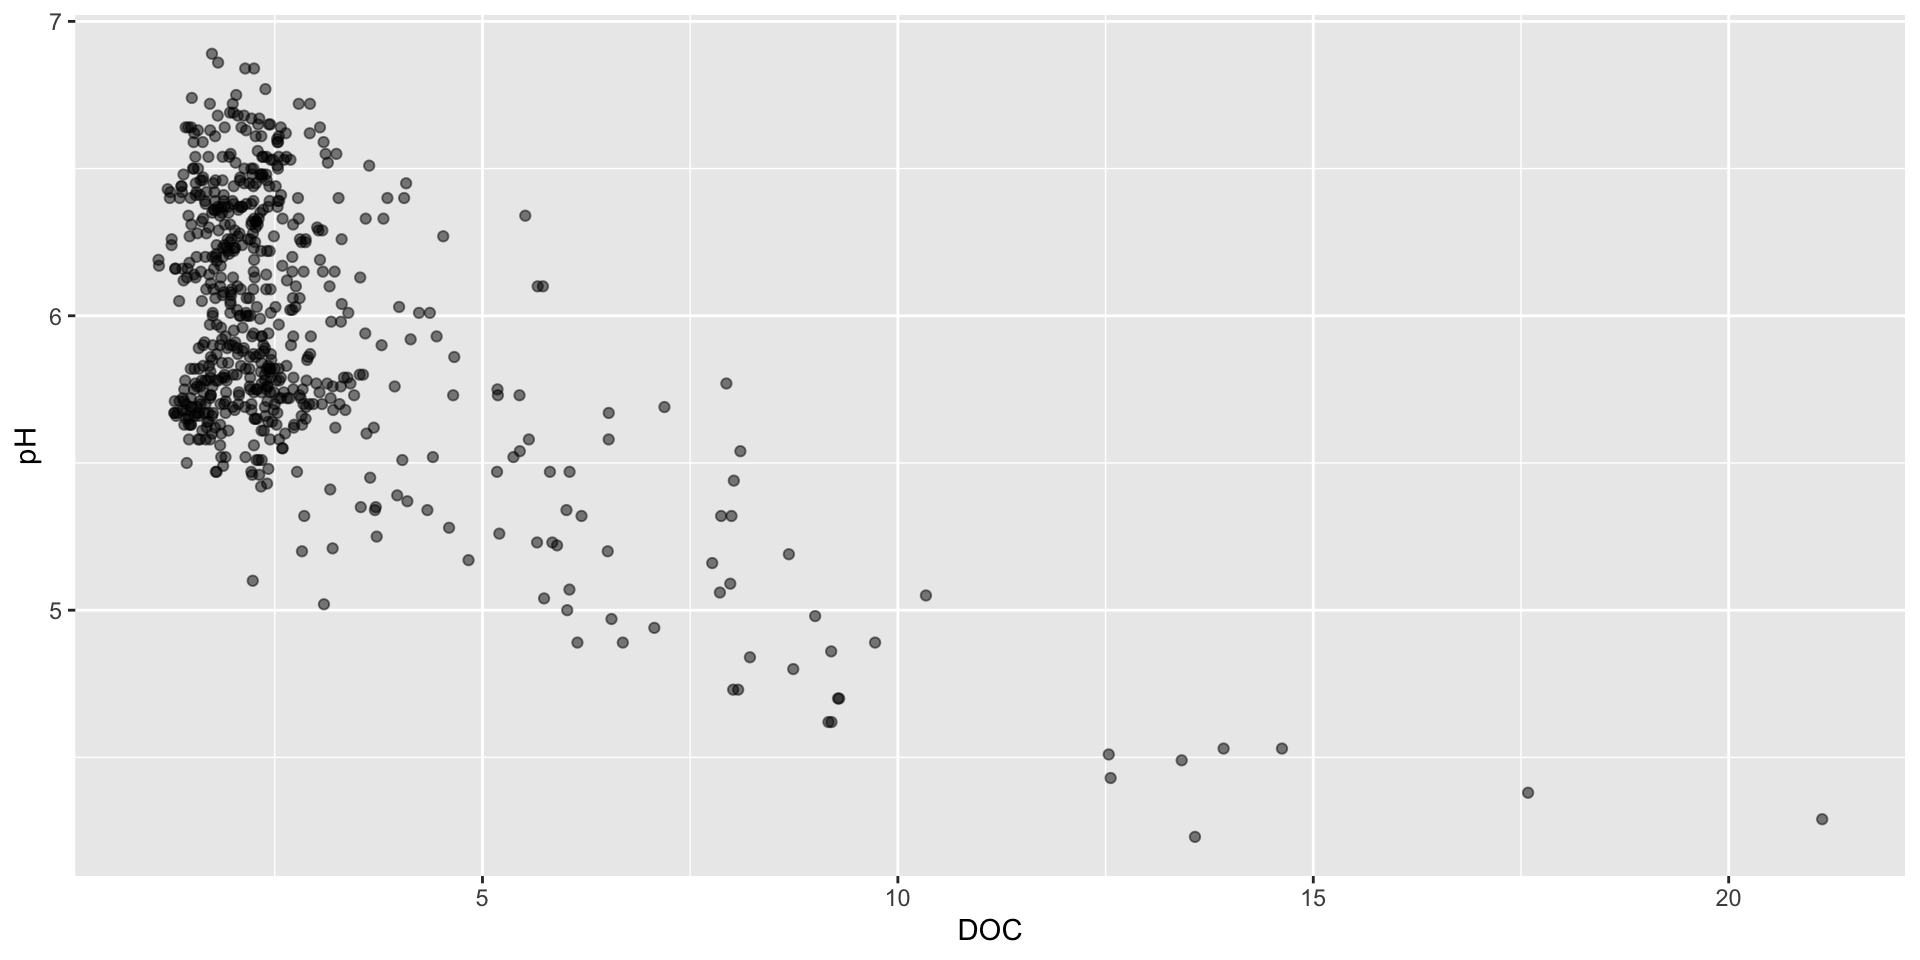
Scatter Plots
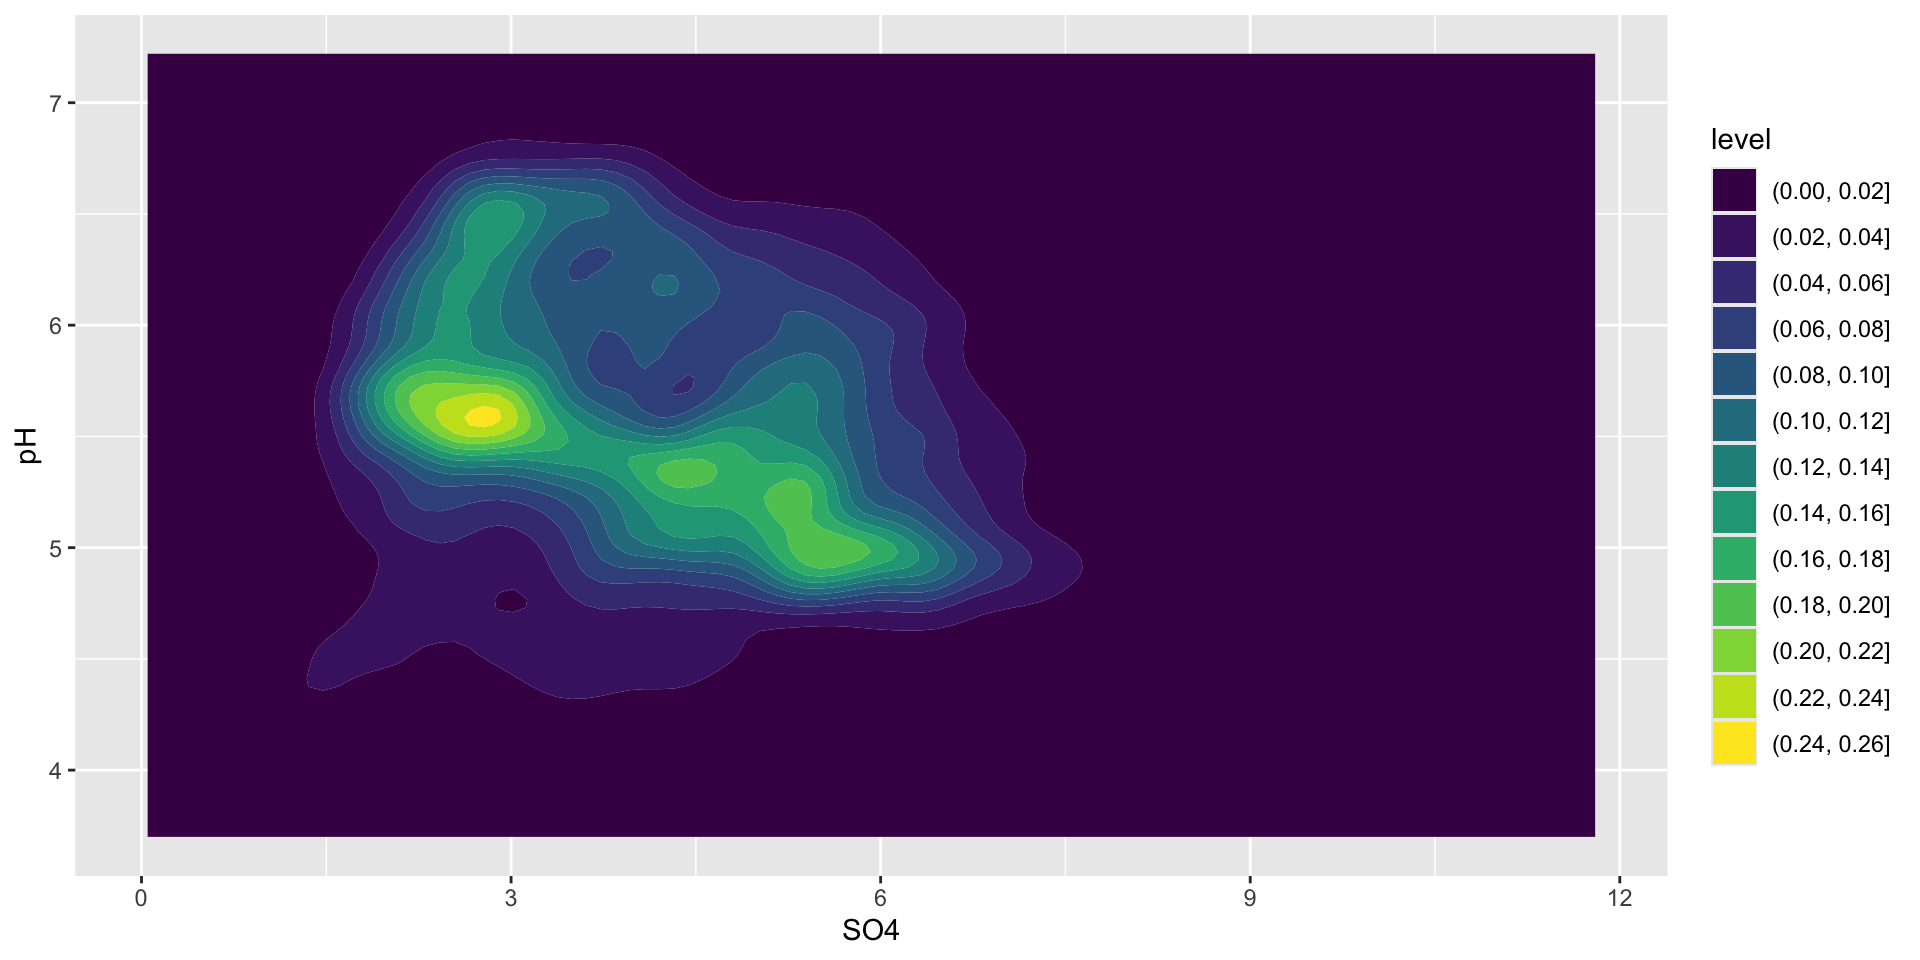
2D density plots
- The {ggExtra} can be used to add marginal histograms/ boxplots/ density plots to ggplot scatter plots
- If suitable, you can add a trend line or line of best fit using geom_smooth()
- You can add in a third numeric variable by creating a bubble chart or using color (Use caution and address these challenges)
- Overplotting can disguise trends
- The {ggdensity} provides alternative functions for contour lines and filled contours
A Decision Tree for Data Visualization
The From Data to Viz website helps you:
- Navigate from your data type to the right chart
- Understand the purpose of each visualization
- See real examples with code (in R!)
- Avoid common visualization pitfalls
Bookmark this! It’s an invaluable reference when you’re stuck choosing a chart type.
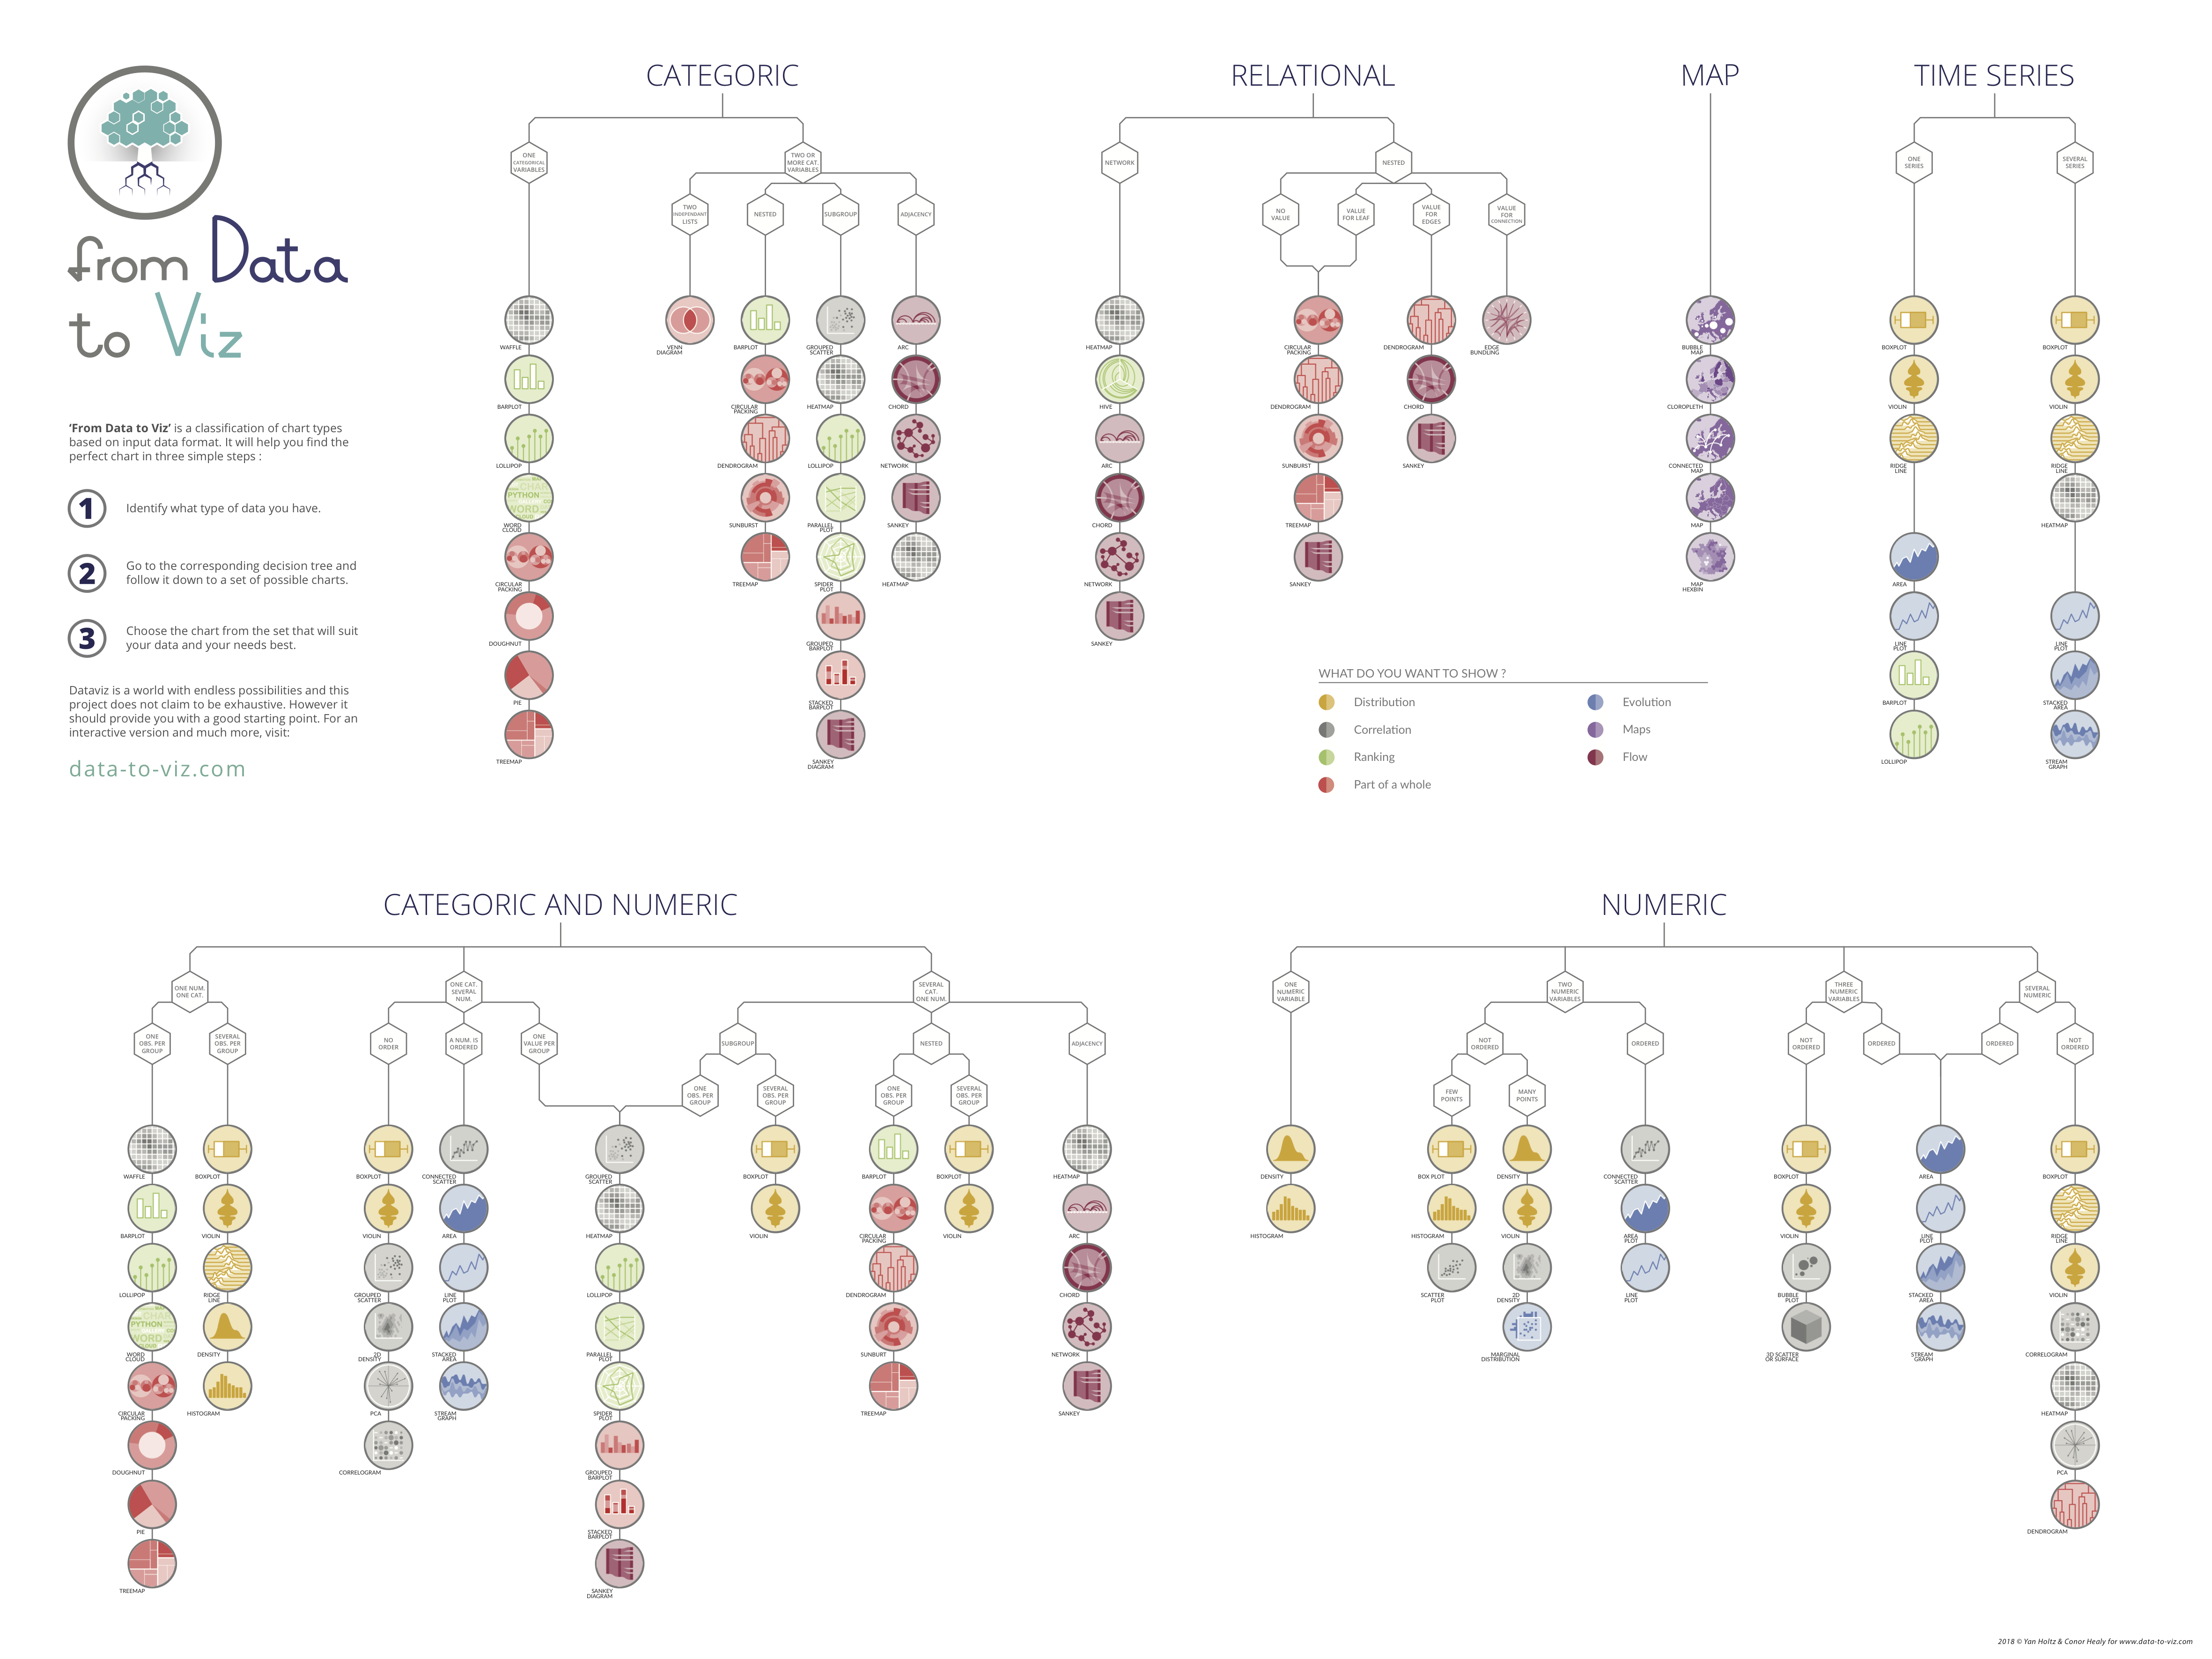
Interactive decision tree walks you through fundamental chart selection