Artwork by Allison Horst


This course will focus on the basic principles for effective communication through data visualization and using programmatic tools and workflows for creating and sharing data visualizations with diverse audiences.
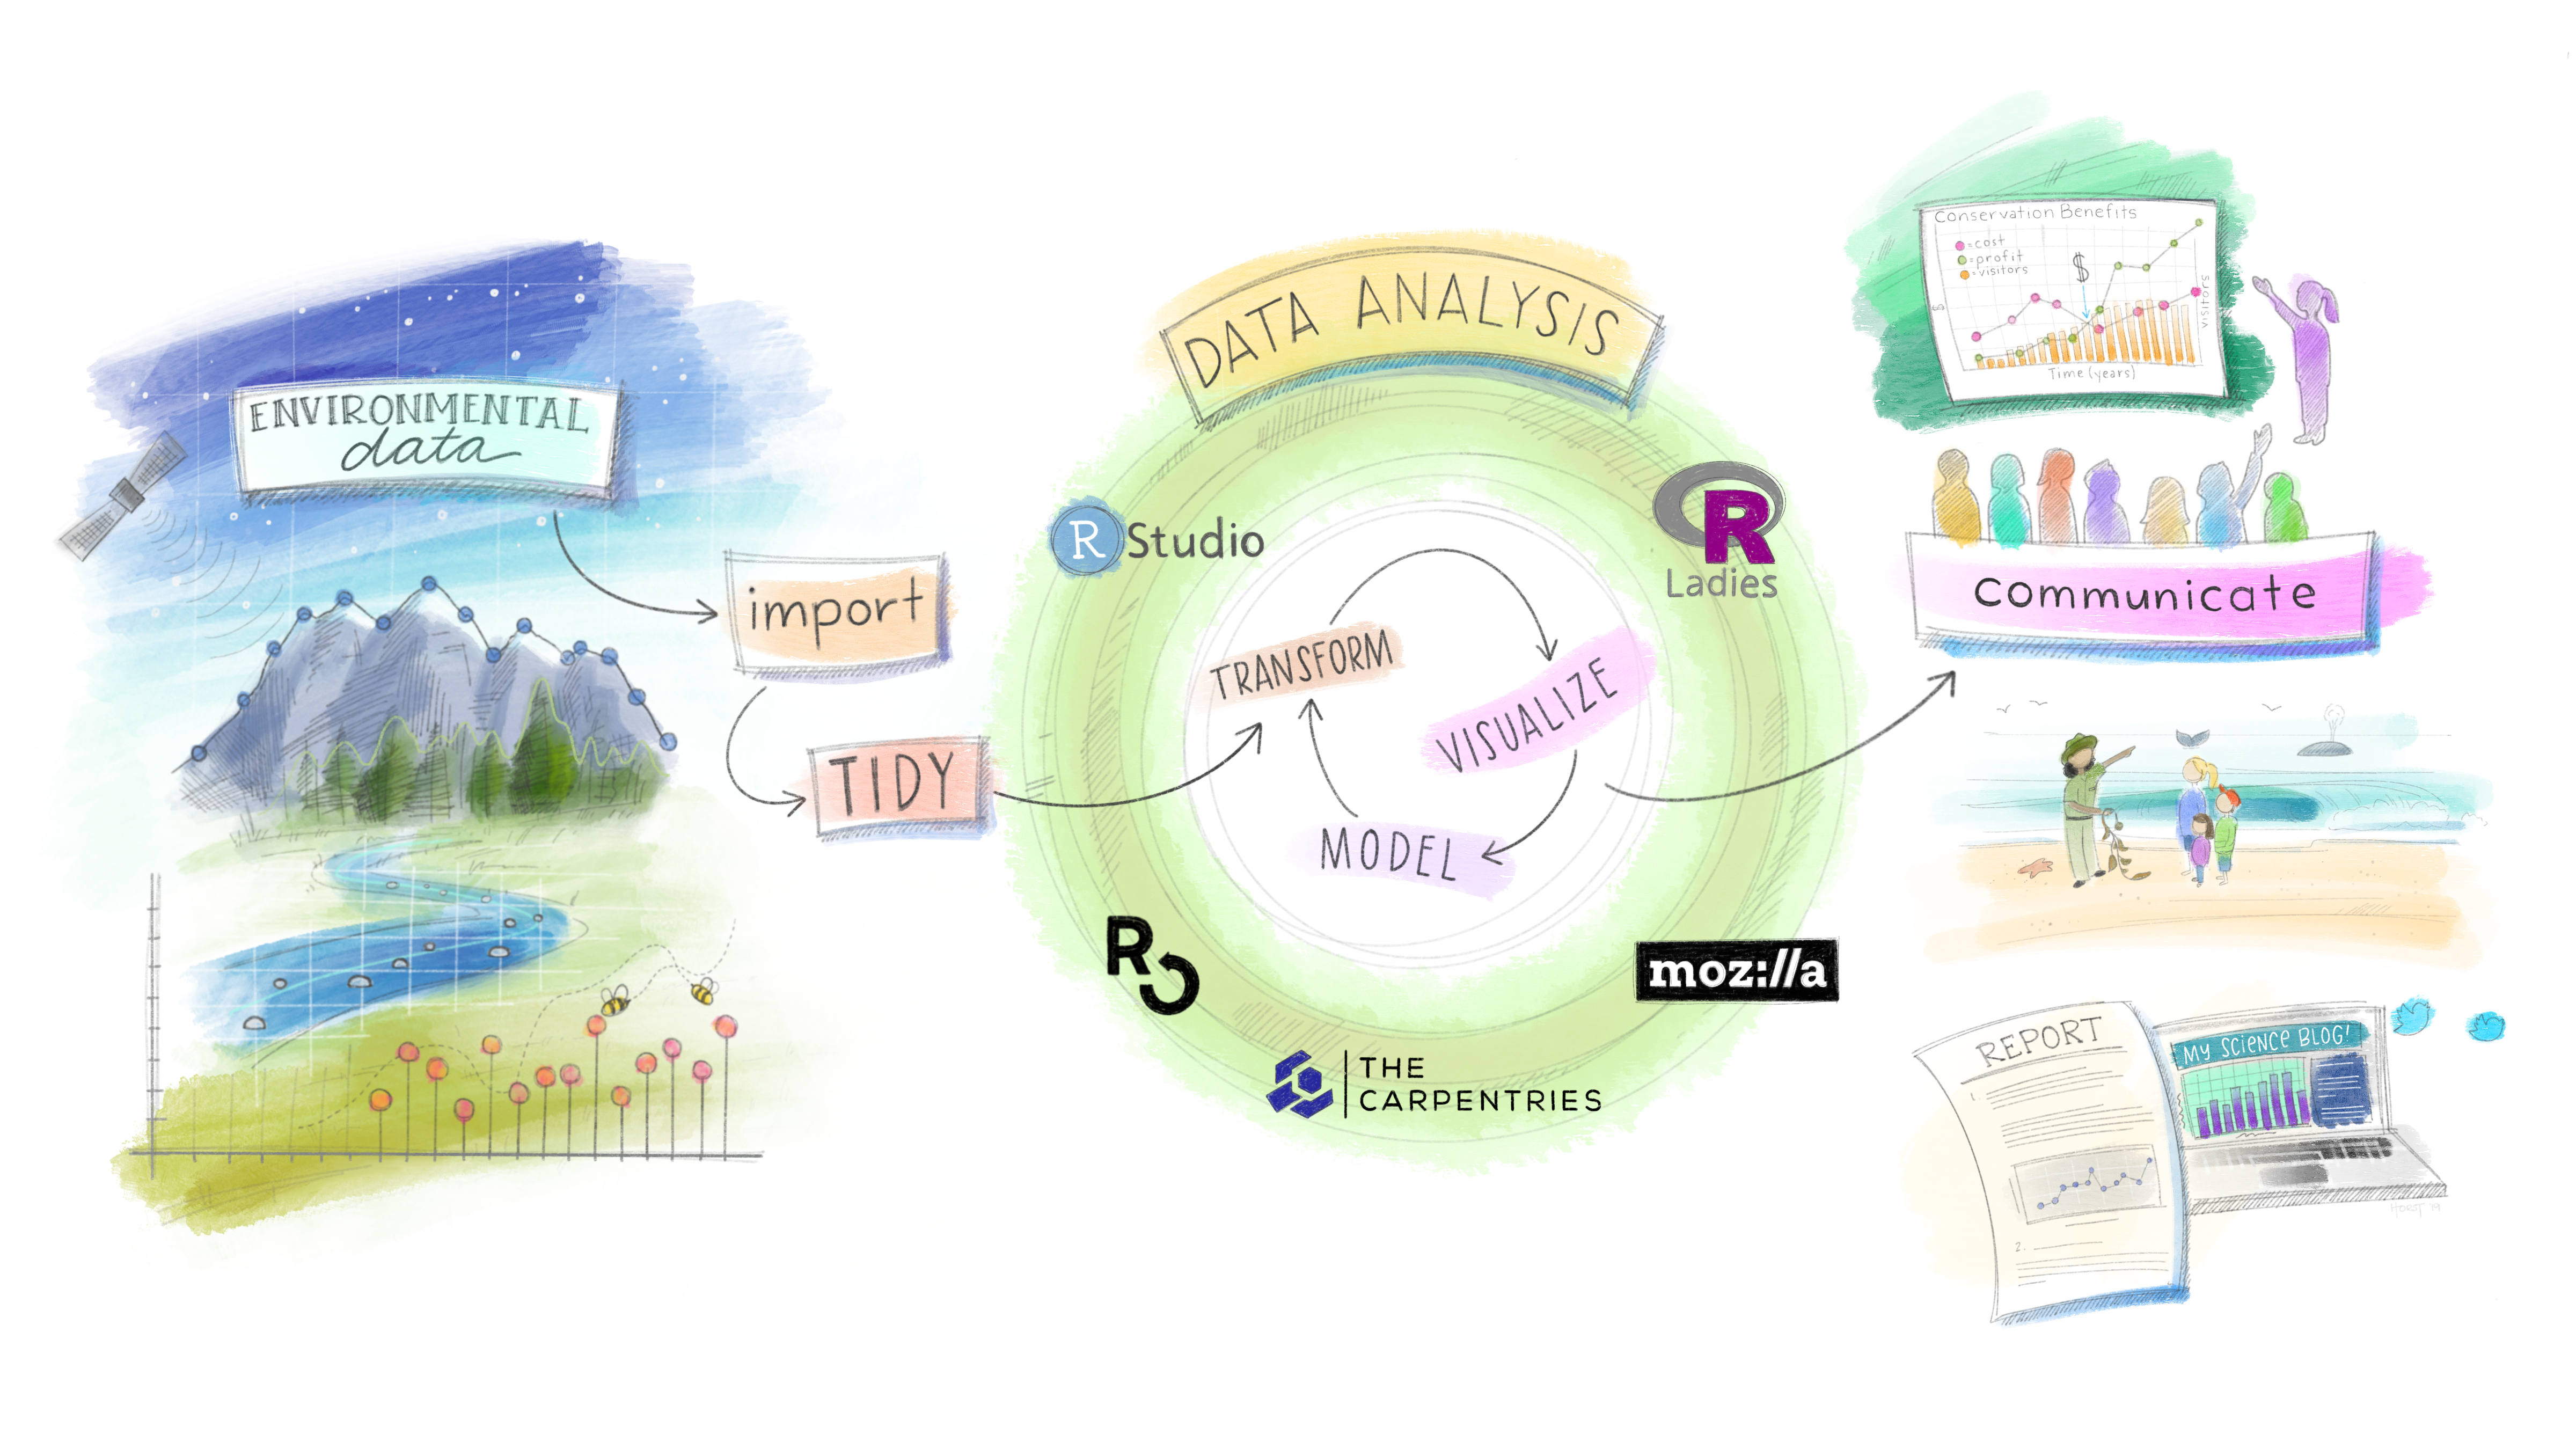
Artwork by Allison Horst
Instructor
Sam Shanny-Csik
Email: scsik@ucsb.edu
Learn more: samanthacsik.github.io
Student hours: Tuesdays 1:00-2:00pm
Co-instructor

Annie Adams
Email: aradams@ucsb.edu
Learn more: annieradams.github.io
Student hours: Thursdays 2:00-3:00pm
Please read the syllabus in full this week, if you haven’t already!
| Week | Date | Tentative Topic |
|---|---|---|
| 1 | 1/07 | course logistics, intro, {ggplot2} review |
| 2 | 1/14 | tbd |
| 3 | 1/21 | tbd |
| 4 | 1/28 | tbd |
| 5 | 2/05 | tbd |
| 6 | 2/11 | tbd |
| 7 | 2/18 | tbd |
| 8 | 2/25 | tbd |
| 9 | 3/04 | tbd |
| 10 | 3/11 | tbd |
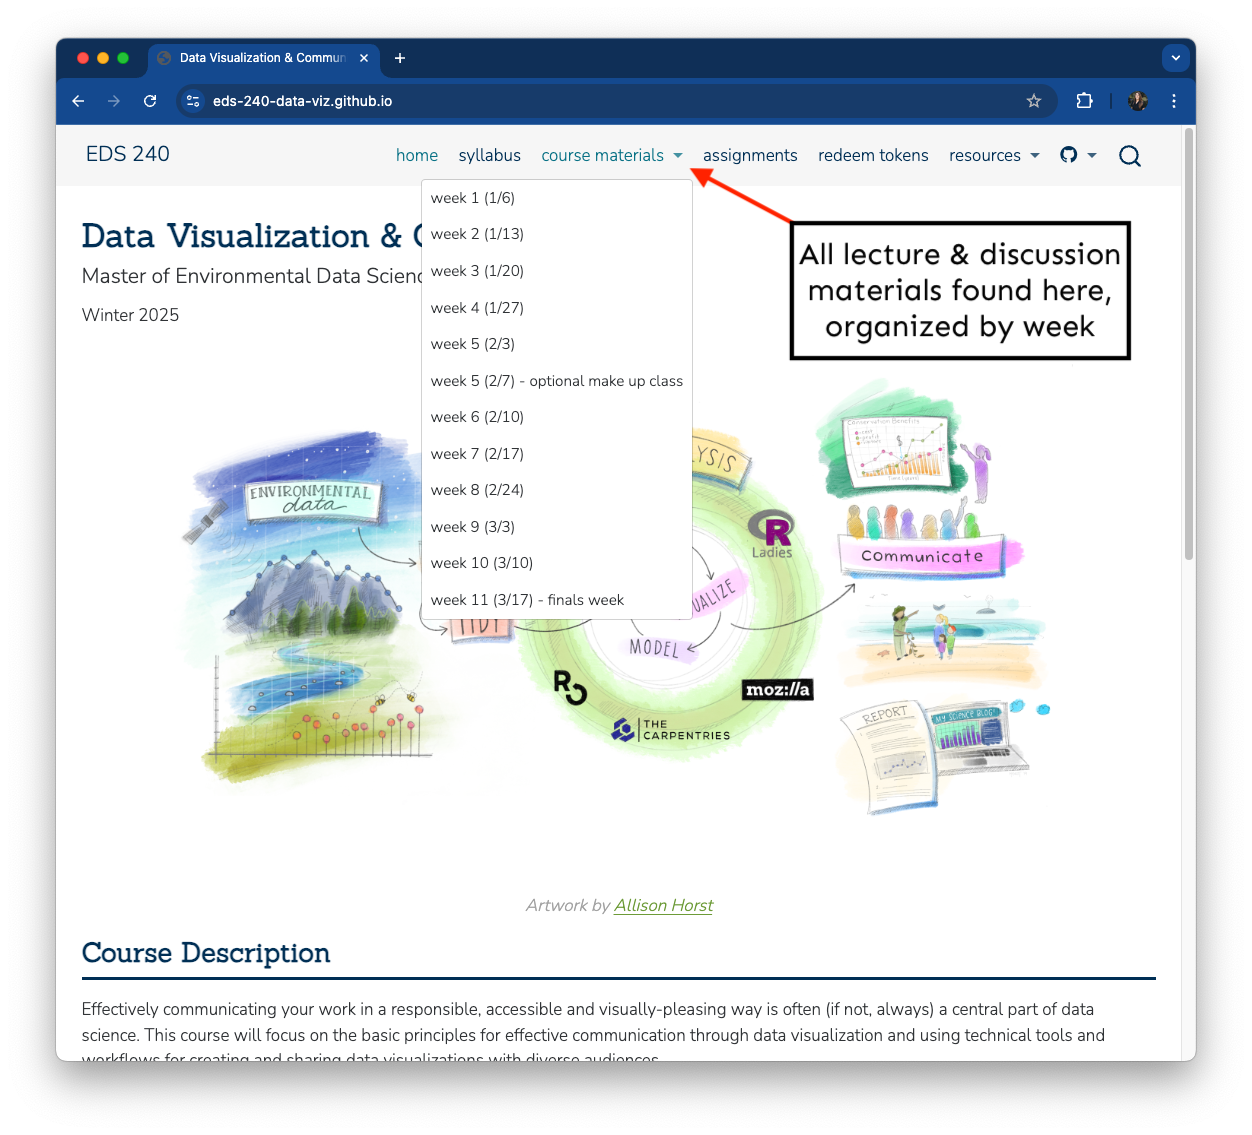
Please be sure to carefully complete all required prep (e.g. installing packages, downloading data) under the Pre-class Prep section (organized by week) before lecture – be mindful that some items may take time to download/install.
It is highly recommended that you do this well in advance1 of attending lecture.
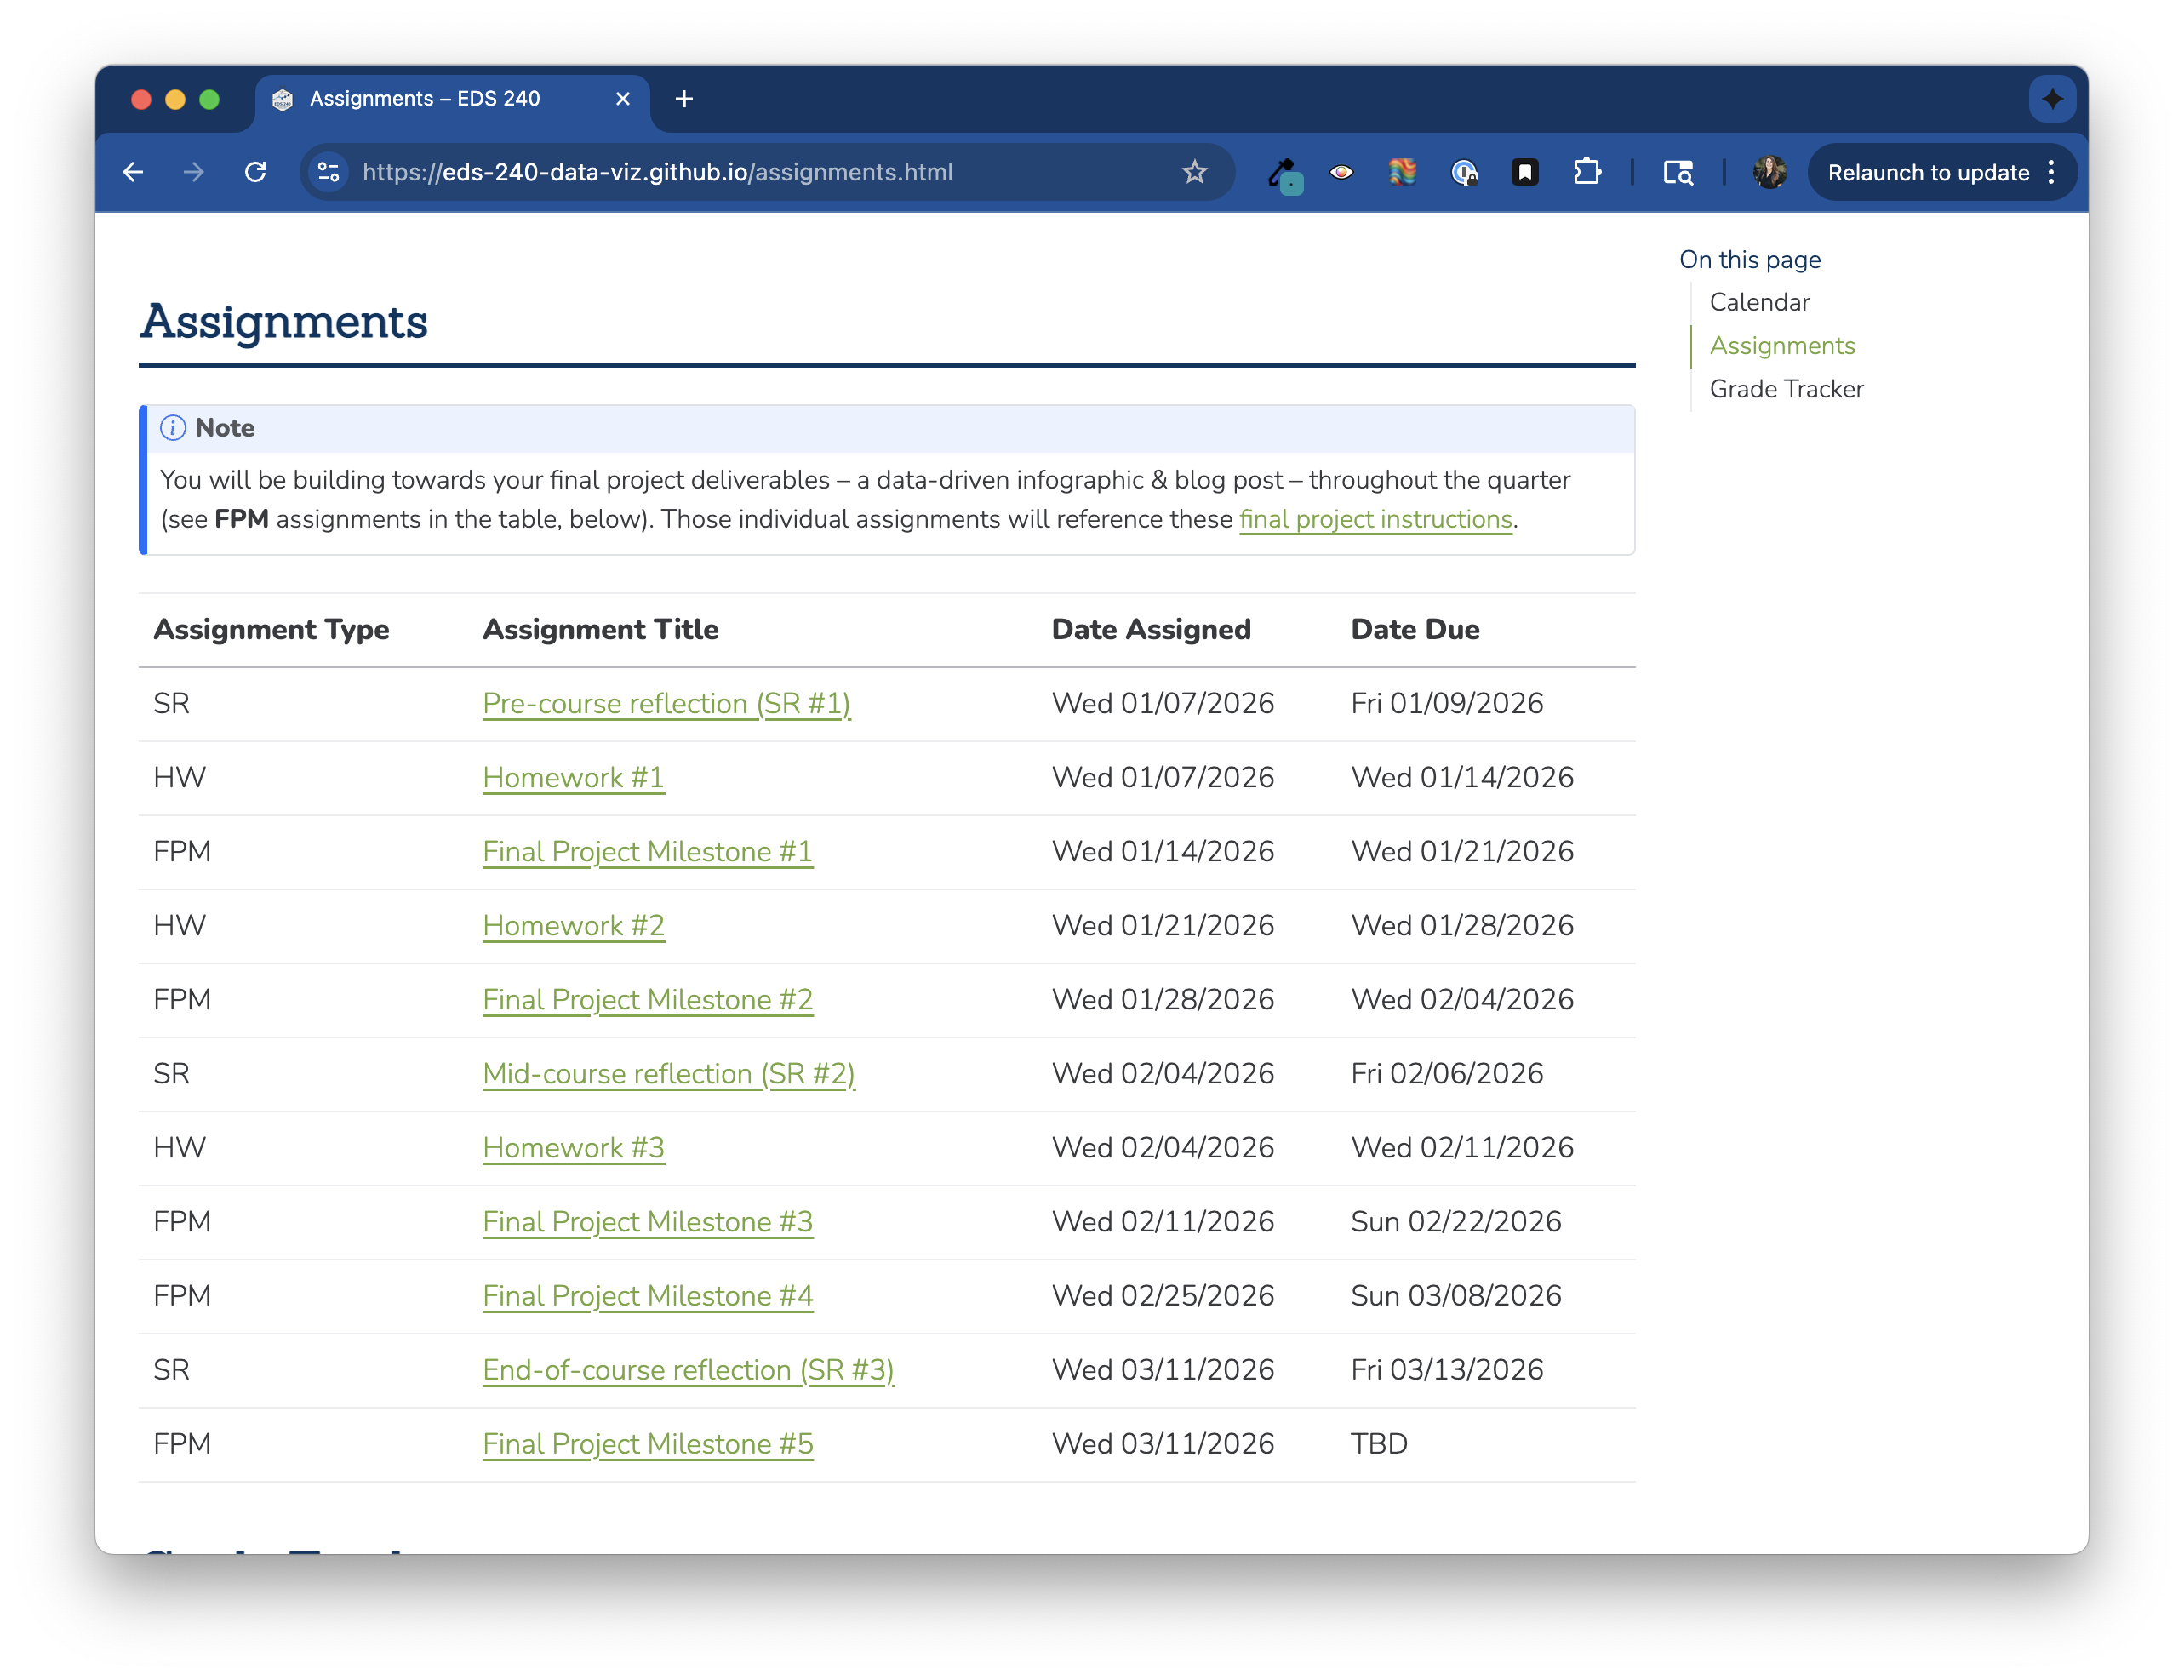
All assignments (HWs, FPMs, SRs) are published on the assignments page.
You are not expected to look ahead, but materials are available so you can see what’s coming throughout the quarter and plan your time, if helpful.
Please note: we will not be grading assignments before thier listed due dates.
All course-related content questions should be asked in the #eds-240-data-viz channel – oftentimes there are others who have the same question and will benefit from seeing the discussion.
We will do our best to respond to Slack questions within 24hr (during the week). Responses after hours (5pm - 9am) are not guaranteed.