EDS 240: Lecture 1.1

Course logistics & syllabus


Week 1 | January 6th, 2025

Welcome to EDS 240!


This course will focus on the basic principles for effective communication through data visualization and using technical tools and workflows for creating and sharing data visualizations with diverse audiences.

An extended version of the classic R4DS schematic from Grolemund & Wickham, with environmental data science, communities, and communication added.

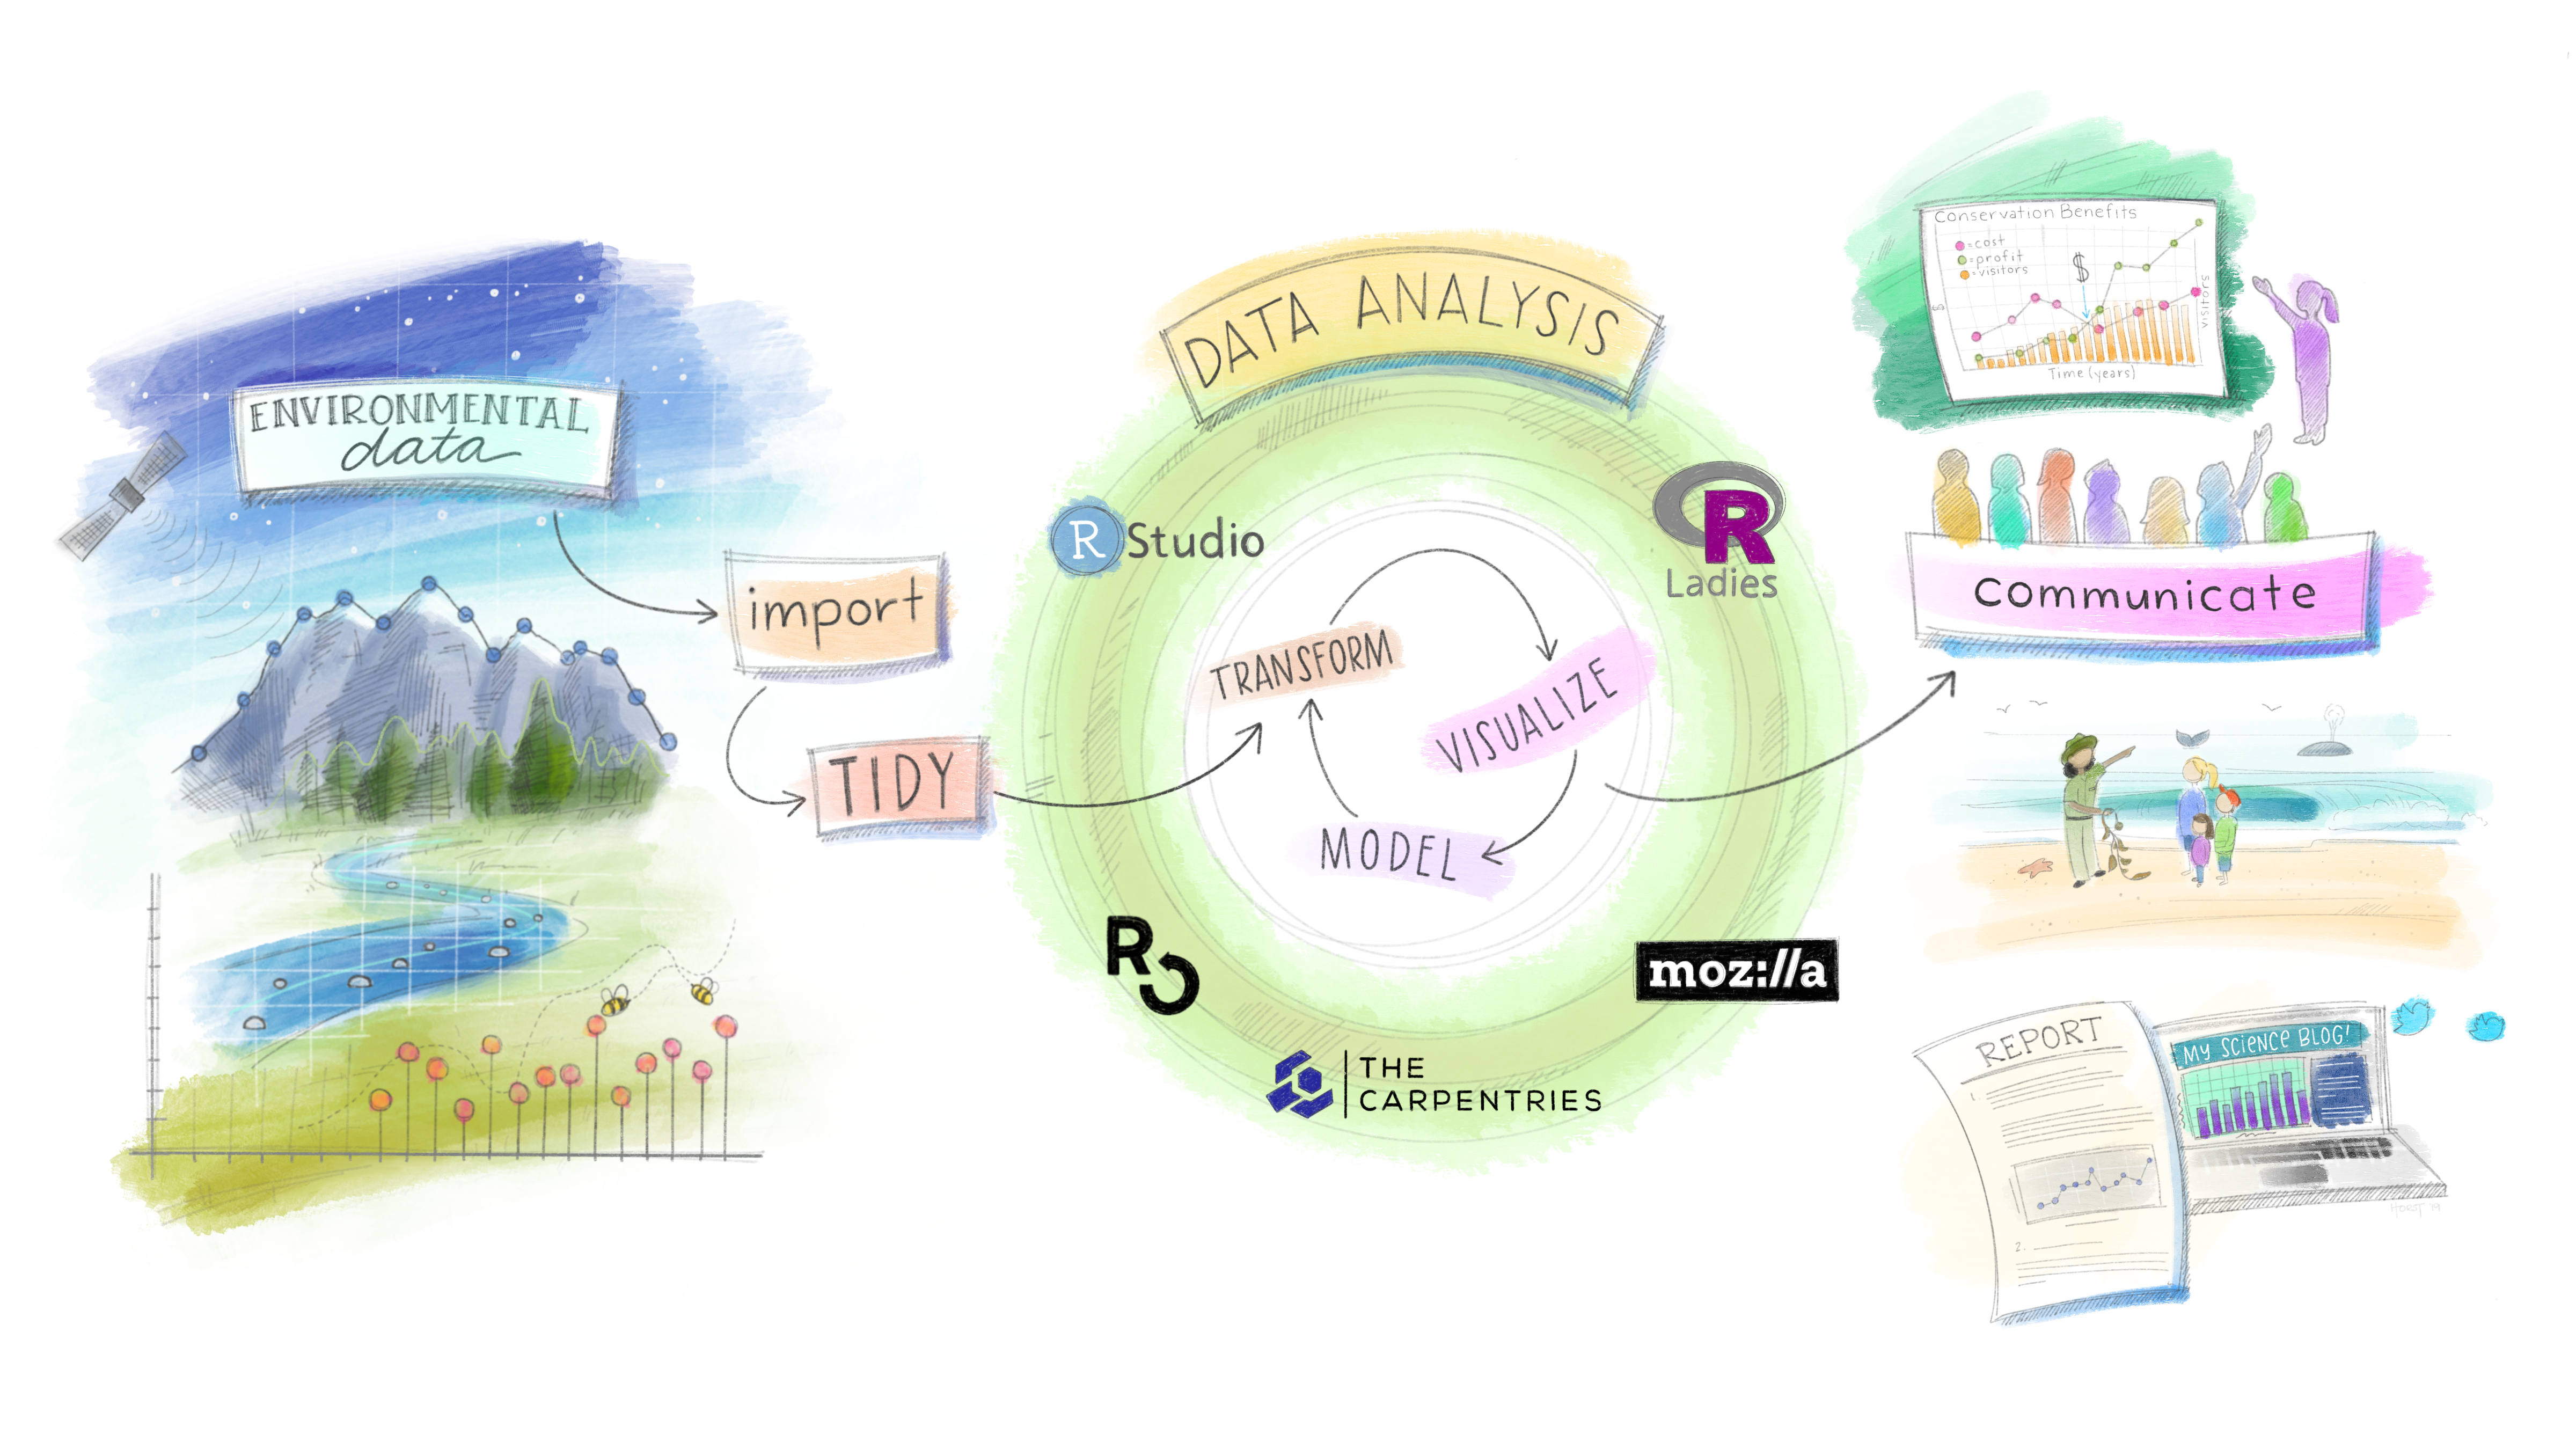
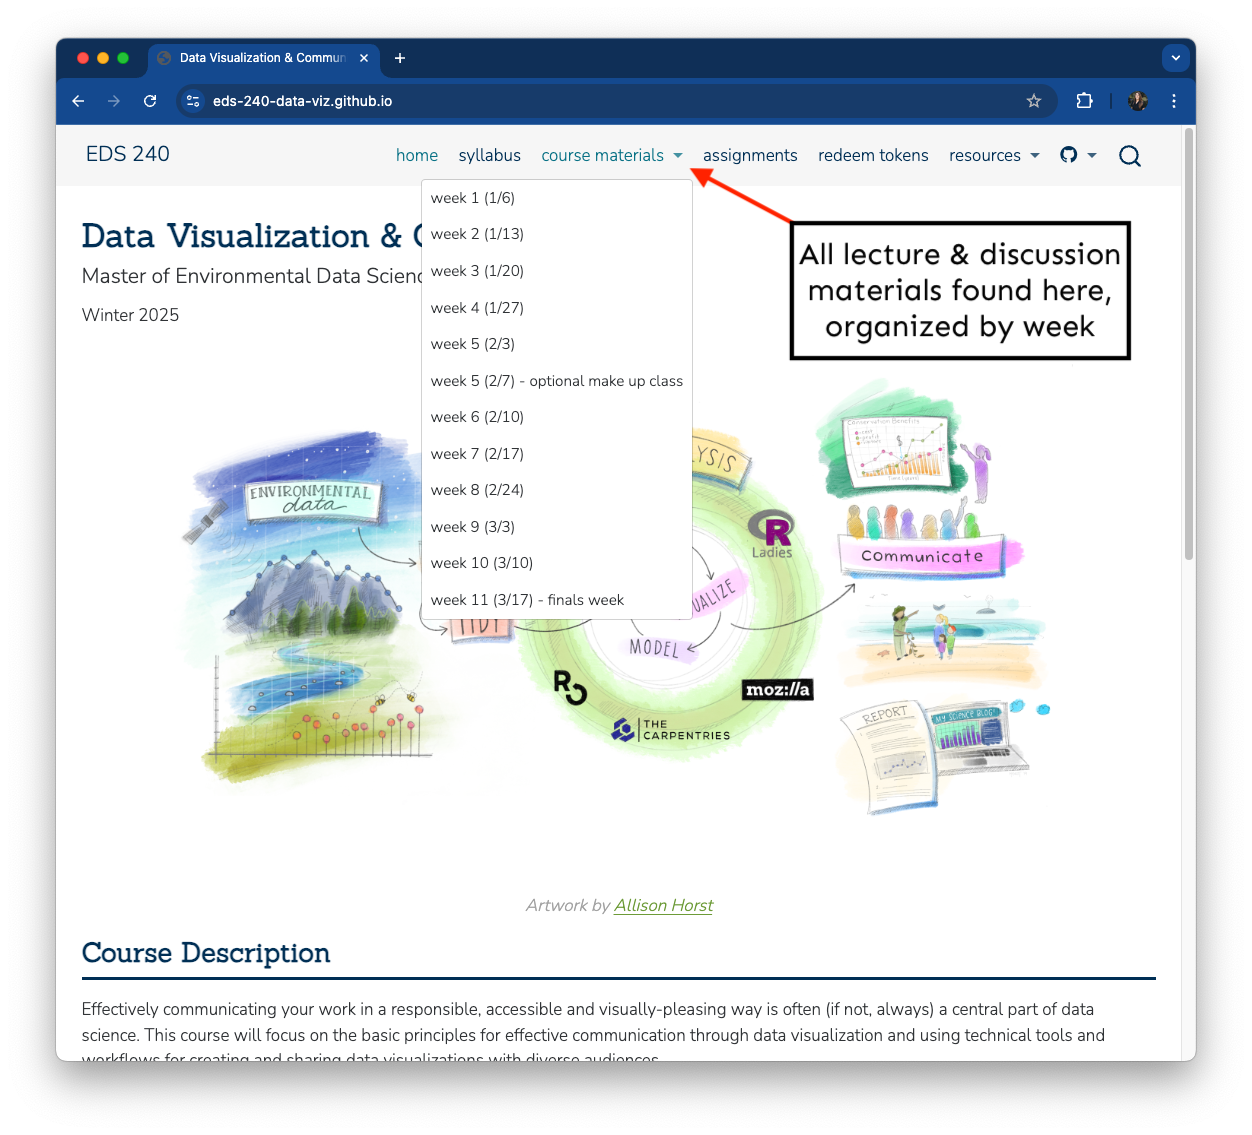
Artwork by Allison Horst
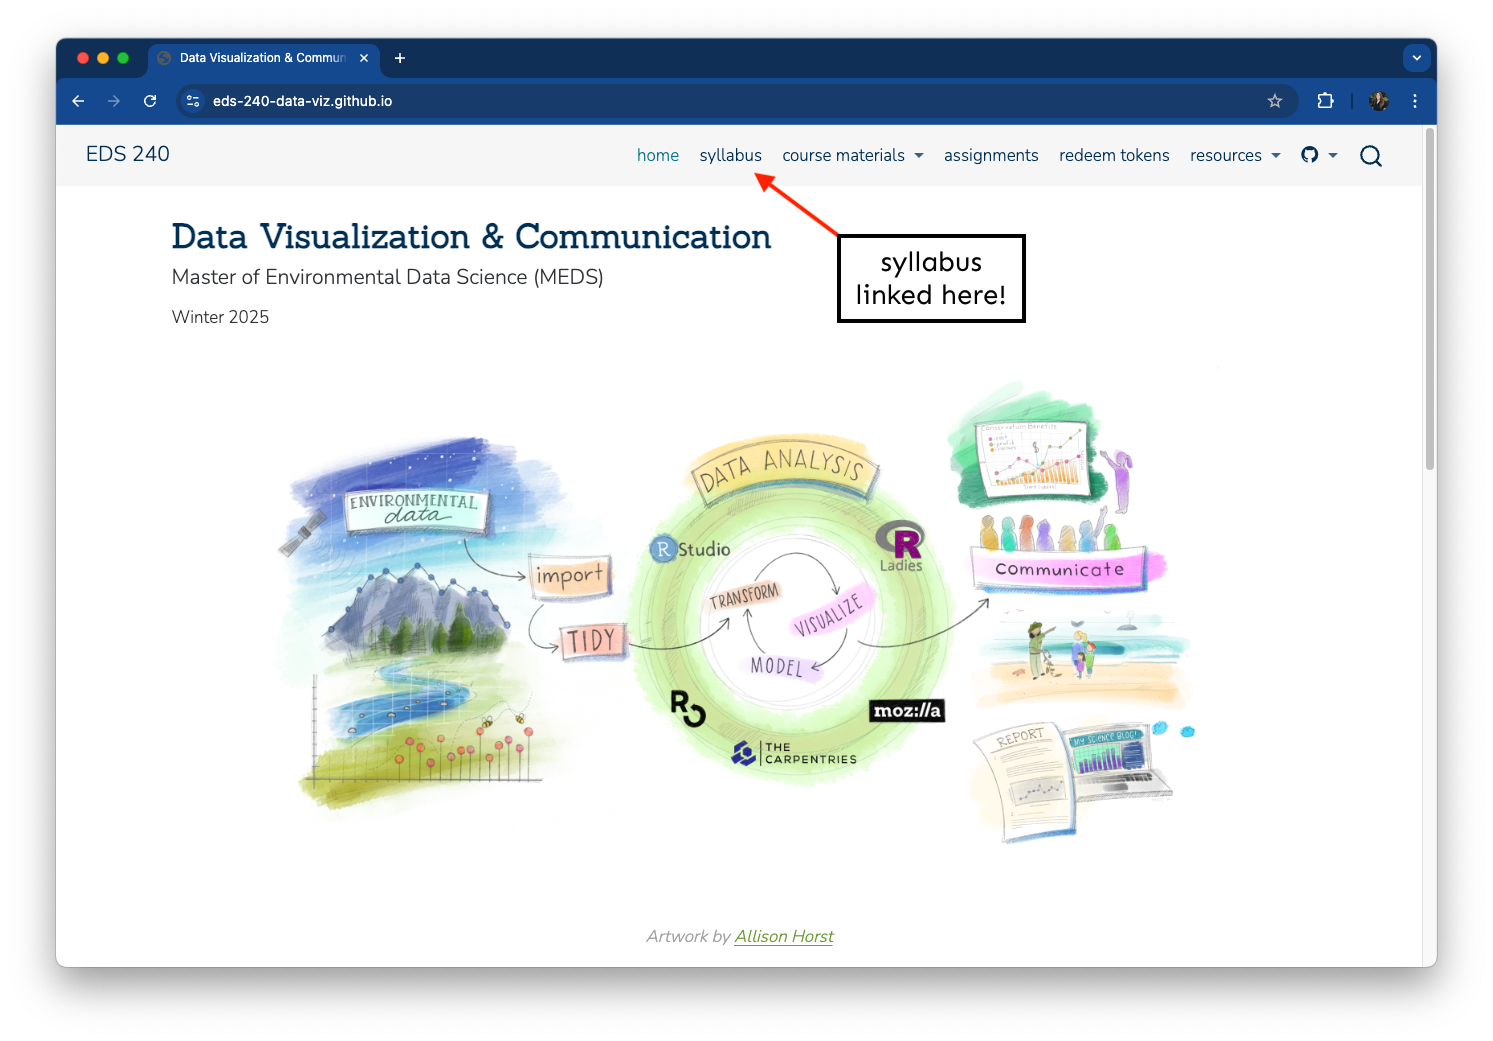
Meeting times & locations


  • Class: Mondays 12:15-3:15pm PT (attendance is mandatory)
  • Discussion Sections: Tuesdays 1:00-1:50am PT & 2:00-2:50am PT


An aerial shot of Bren Hall.


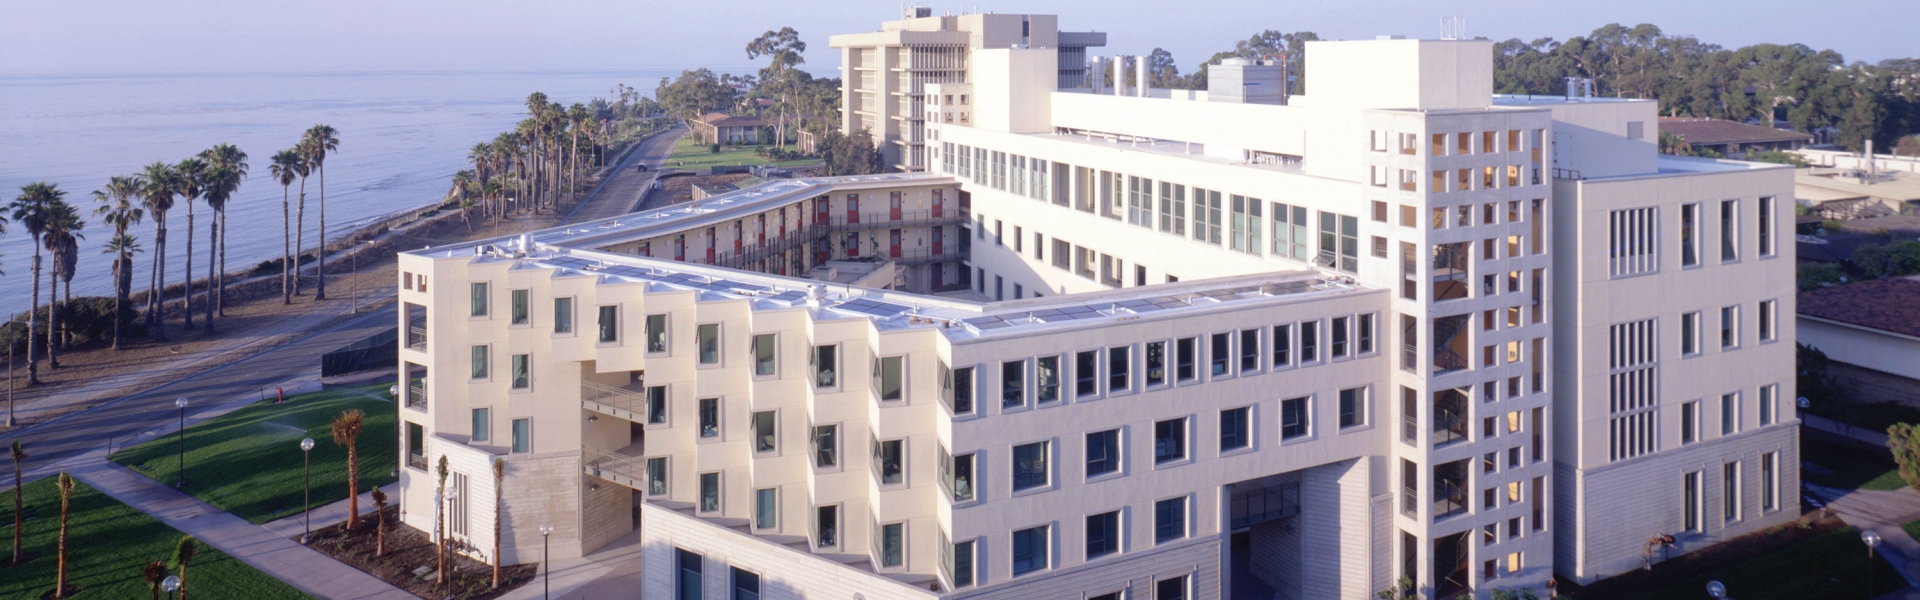
Class & Discussion Sections meet in Bren 3022A (SCF)
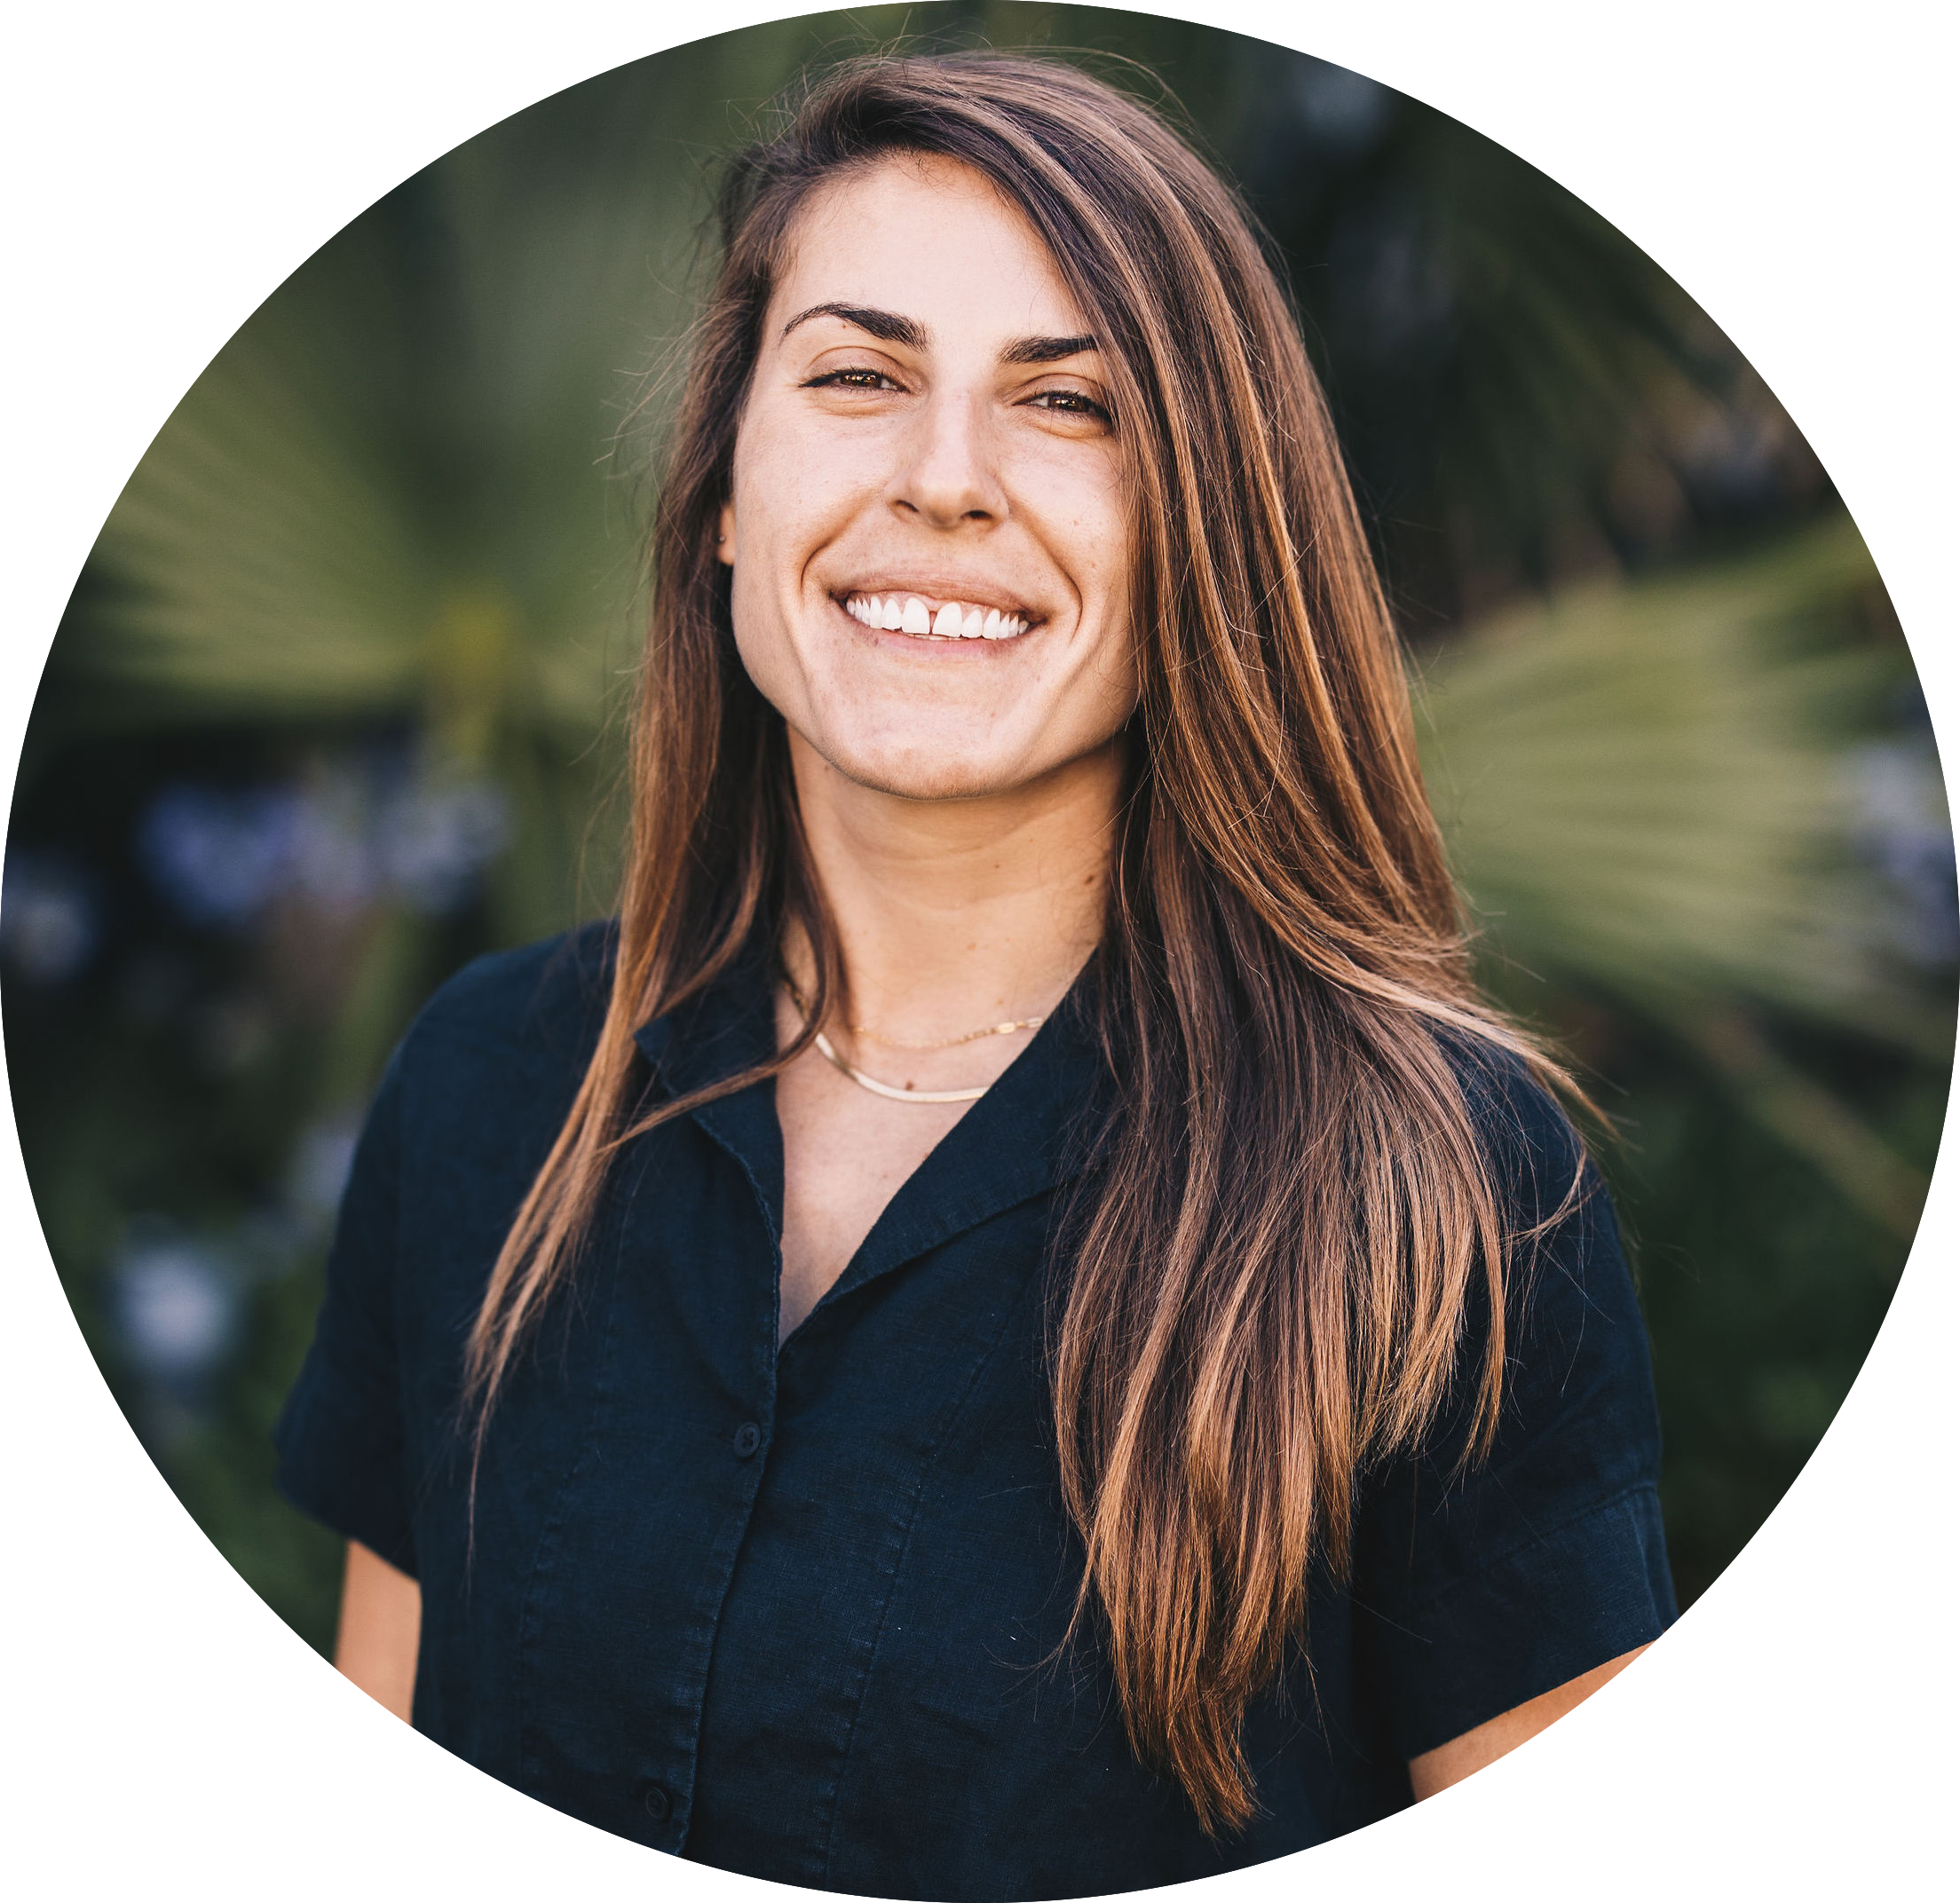
Teaching team


Instructor

Sam Csik
Email: scsik@ucsb.edu
Learn more: samanthacsik.github.io
Student hours: TBD @ Bren

TA

TBD
Email: tbd@ucsb.edu
Learn more: tbd
Student hours: TBD @ Bren

Meet one another!

Spend the next few minutes getting to know your Learning Partners! Below are some conversation starters:

Where do you feel most at home?

What parts of Santa Barbara have you enjoyed exploring?

What’s the most exciting thing you’ve learned this year, so far?

What’s your favorite color or typeface?

04:00

Student Resources


Your mental and physical health is more important than your grade in any course.

I’m always happy to help you identify resources or help on campus – DM or email me!

Conduct, Inclusion, Accommodations


Course Conduct: We are committed to actively creating, modeling, and maintaining an inclusive climate and supportive learning environment for all – harassment of any kind will not be tolerated. Everyone is expected read and adhere to the Bren School Code of Conduct and the UCSB Code of Conduct


Access & accommodations: It’s never too late to apply for DSP accommodations


Names & pronouns: Everyone has the right to be addressed and referred by to name and pronouns in accordance with their identity – you can add your pronouns to your UCSB Registrar profile

Everything you’ll need lives on the course website!


Link is also bookmarked at the top of the #eds-240-data-viz Slack channel and linked on the Courses page of the MEDS website.

Tentative Schedule & Materials


Date Tentative Topic
1/06 course logistics, intro, {ggplot2} review
1/13 graphic forms, fundamental chart types (part I)
1/20 no class
1/27 fundamental chart types (part II)
2/03 enhancing visualizations (part I)
2/10 enhancing visualizations (part II)
2/17 no class
2/24 data storytelling, people as data
3/03 OJS with Dr. Allison Horst
3/10 grab bag & catch up

Discussion sections are held every week

Complete all items under Pre-class Prep before lecture


Please be sure to carefully complete all required prep (e.g. installing packages, downloading data) under the Pre-class Prep section (organized by week) before lecture – be mindful that some items may take time to download/install.

It is highly recommended that you do this well in advance of attending lecture.

Assignments


Your course grade will be based off the following:

  • 3 Self-reflections - a place to reflect on your learning plan / goals, challenges, etc. (5 days to complete each)
  • 4 Homework Assignments - longer assignments where you’ll apply conceptual knowledge & technical skills to data viz tasks (10 days to complete each)
  • 8 End-of-class surveys - short surveys to help me better understand your weekly class experience (due by EOD each day there is lecture)
  • 8 Lectures - a mix of slide-based lectures, live-coding, and individual / group-based critical thinking and technical exercises (attendance mandatory, Mondays 12:15-3:15pm PT)

How will I be evaluated?


This class will implement an alternative grading approach called specifications (specs) grading.

“an alternative grading method where instructors create a list of specifications that describe the qualities and characteristics of a successful submission for an assignment. Student work is graded holistically based on those specifications, earning a single mark: “Satisfactory” or “Not Yet”. Students have the chance to use feedback by revisiting and resubmitting for full credit.”

-expert from “Grading for Growth: A Guide to Alternative Grading Practices That Promote Authentic Learning and Student Engagement in Higher Education”, by David Clark & Robert Talbert

Why Specs grading?


“Traditional” grading can come with some challenges:


  • lacks feedback loops
  • benefits those who learn fast or have prior experience
  • bias-prone (e.g. awarding points, granting extensions)
  • can discourage learning for its own sake
  • can promote unhealthy student-instructor relationships

How does specs grading look in practice for this course?


TL;DR: assignments receive either “Satisfactory” or “Not Yet” marks; tokens can be used to revise / resubmit assignments, for assignment extensions, or to miss class; earn tokens by attending discussions

  • assignments receive either a “Satisfactory” or “Not Yet” mark
  • each assignment will have a clear rubric (containing specifications) which outline what must be completed and how in order to receive a “Satisfactory” mark; not meeting all specifications results in a “Not Yet” mark
  • trade “tokens” for the opportunity to:
    • revise / resubmit assignments that receive a “Not Yet” mark (within a week)
    • assignment extensions (24 or 72 hours; max of 72 hours per assignment)
    • to miss class (though see sickness & emergency policy)
  • earn tokens (primarily) by attending discussion section

Why tokens?


Everyone has different responsibilities & demands – tokens give you the power and freedom to ask for the accommodations you need.


You do not need to provide a reason to request an extension, resubmission, or to miss class, but you must have enough tokens to do so.


Tokens are not limitless and they accrue weekly (i.e. you don’t receive them all at the start), so use them wisely!

Earning & using tokens


Earn tokens:

  • everyone starts with 0 tokens
  • earn your first token by attending discussion section on Tuesday 1/7
  • earn 2 more tokens by submitting Self-reflection #1
  • earn 1 token per week by attending discussion section (full 50 min)


Use tokens:

Fill out this Google form: https://forms.gle/TzD7ihnuK9vbnQbb6 and email Sam & Sevan to let them know

Use the Grade Tracker to determine your course grade


Policy on Generative AI (GenAI)


GenAI tools (such as ChatGPT) are strongly discouraged for the following reasons:

  • core competencies are built through practice
  • building your own programming proficiency will help you engage with GenAI tools more productively
  • subscription versions of GenAI tools may induce an inequitable learning environment

Please adhere to these guidelines:

  • you may use spell / grammar check and / or synonym identification tools
  • be prepared to explain each line of code in your assignments and exercises
  • if you use GenAI in assignments, you must include a statement of which GenAI platform used and why, along with a copy of your initial prompt(s) and ensuing “conversation(s)”

Please read the full policy on the course syllabus

Getting unstuck


Troubleshooting, deciphering code, and trying (and failing at) new things is a large part of being a data scientist. Grad school is a safe space to get comfy with and practice these! Here’s how you should approach getting unstuck:

Check out the getting unstuck page (under “resources”) on the course website for more tips – particularly a reminder of how to ask a question.

A note on pushing through the challenges


“There is no way of [going from] knowing nothing about a subject to knowing something about a subject without going through a period of much frustration and suckiness.” “Push through. You’ll suck less.”

-Hadley Wickham, author of {ggplot2}


A note on using Slack


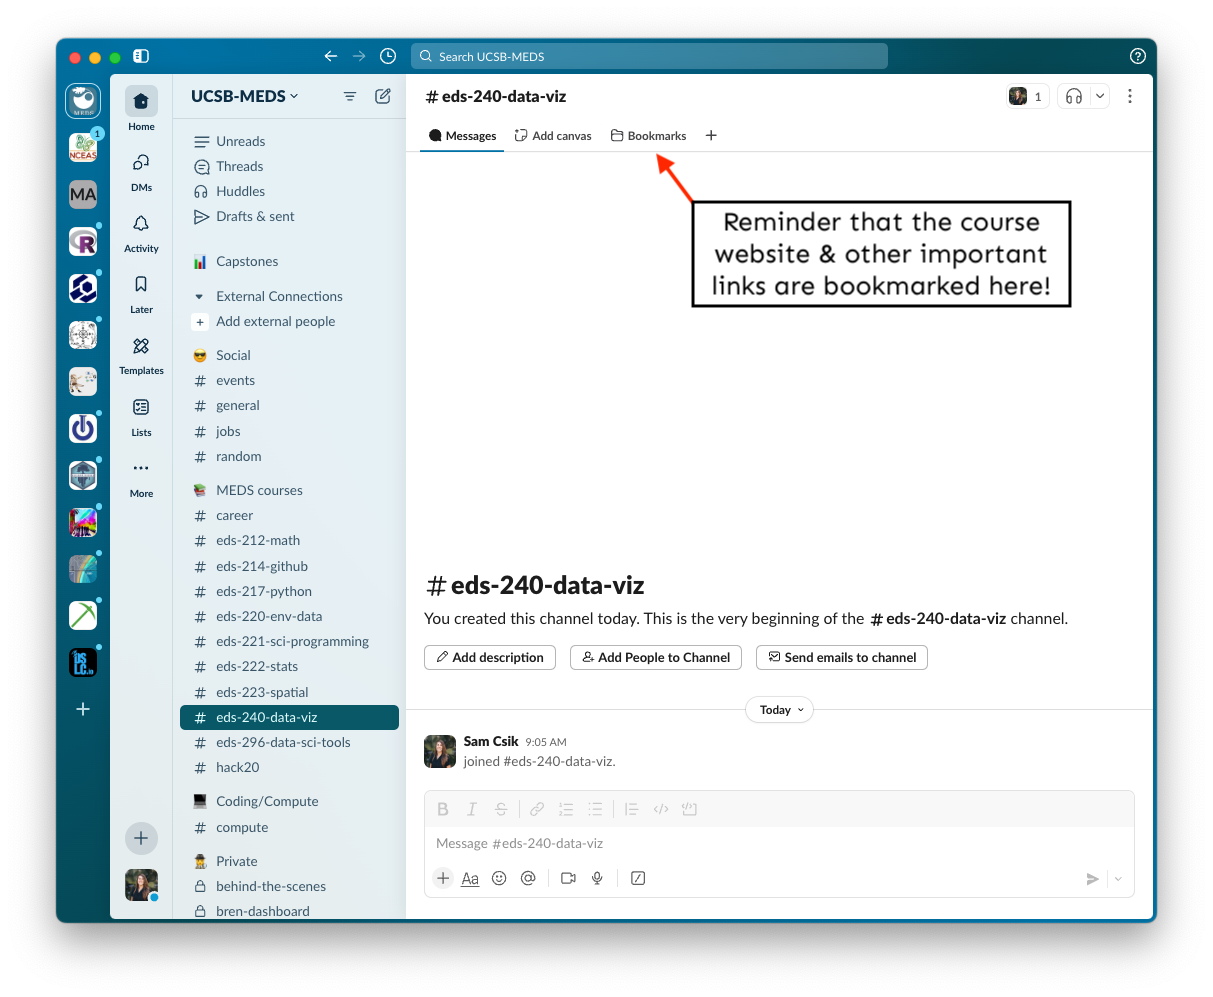
All course-related content questions should be asked in the #eds-240-data-viz channel – oftentimes there are others who have the same question and will benefit from seeing the discussion!


Any questions sent as DMs will be copied into #eds-240-data-viz and answered there.


Of course, please direct message or email with any personal questions or concerns.

A note on expectations


Reminders:

  • We are not mind-readers (as helpful as that would be!). Please help us help you by bringing any issues to our attention (EOC surveys are a great place to do this, or via DM / email) – the earlier the better!

Promises:

  • We are working, and will continue to work, really hard to make this a great class!
  • We are super passionate about teaching, but doesn’t mean it’s easy or that we’re infallible. We will do our best to adapt to student / class needs as the quarter progresses. There may be times where we won’t or can’t make changes to the course plan – if so, we will be transparent in our reasoning why.

Boundaries:

  • This course (unfortunately) isn’t our only professional responsibility this quarter – we will not be available at all times to respond to requests / questions. Here’s what you can expect:
    • We will try our best to respond to Slack questions within 24hr (during the week)
    • A response after-hours (5pm - 9am) is not guaranteed (we will try our best, as our personal lives allow for)
    • We will not be responding to questions over the weekend

What is EDS 240?


EDS 240: Data Visualization and Communication is about two related, but distinct things:


1. The theory of effective communication and data design

How people perceive and interpret graphical information
Human-centered design as it relates to data visualizations


2. The physical act of building effective data visualizations using software and data science tools

Using the Grammar of Graphics / {ggplot2} framework to create effective, truthful, and beautiful data visualizations

What is EDS 240?


The topic of data visualization is pretty darn massive.

We cannot and will not cover every data visualization type, consideration, package, etc.


We will work towards a conceptual and technical understanding of data viz fundamentals.


Data viz is a science and technical skill, but there’s also a lot of space for creativity.


What you create can be used in your professional portfolio! The more you put in, the more you’ll get out.

Course Learning Objectives


Identify which types of visualizations are most appropriate for your data and your audience


Prepare (e.g. clean, explore, wrangle) data so that it’s appropriately formatted for building data visualizations


Build effective, responsible, accessible, and aesthetically-pleasing, visualizations using the R programming language, and specifically ggplot2 + ggplot2 extension packages


Write code from scratch and read and adapt code written by others


Apply a DEI (Diversity, Equity & Inclusion) lens to the process of designing data visualizations


Assess, critique, and provide constructive feedback on data visualizations

Take a Break

~ This is the end of Lesson 1 (of 3) ~

05:00