EDS 240
  • home
  • syllabus
  • course materials
    • week 1 (1/6)
    • week 2 (1/13)
    • week 3 (1/20)
    • week 4 (1/27)
    • week 5 (2/3)
    • week 5 (2/7) - attendance optional
    • week 6 (2/10)
    • week 7 (2/17)
    • week 8 (2/24)
    • week 9 (3/3)
    • week 10 (3/10)
    • week 11 (3/17) - finals week
  • assignments
  • redeem tokens
  • resources
    • recommended reading & materials
    • guide for writing clean code
    • getting unstuck
    • MEDS installation guide
    • Source Code
    • Report a Bug

Data Visualization & Communication

Master of Environmental Data Science (MEDS)

Winter 2025

An extended version of the classic R4DS schematic from Grolemund & Wickham, with environmental data science, communities, and communication added.

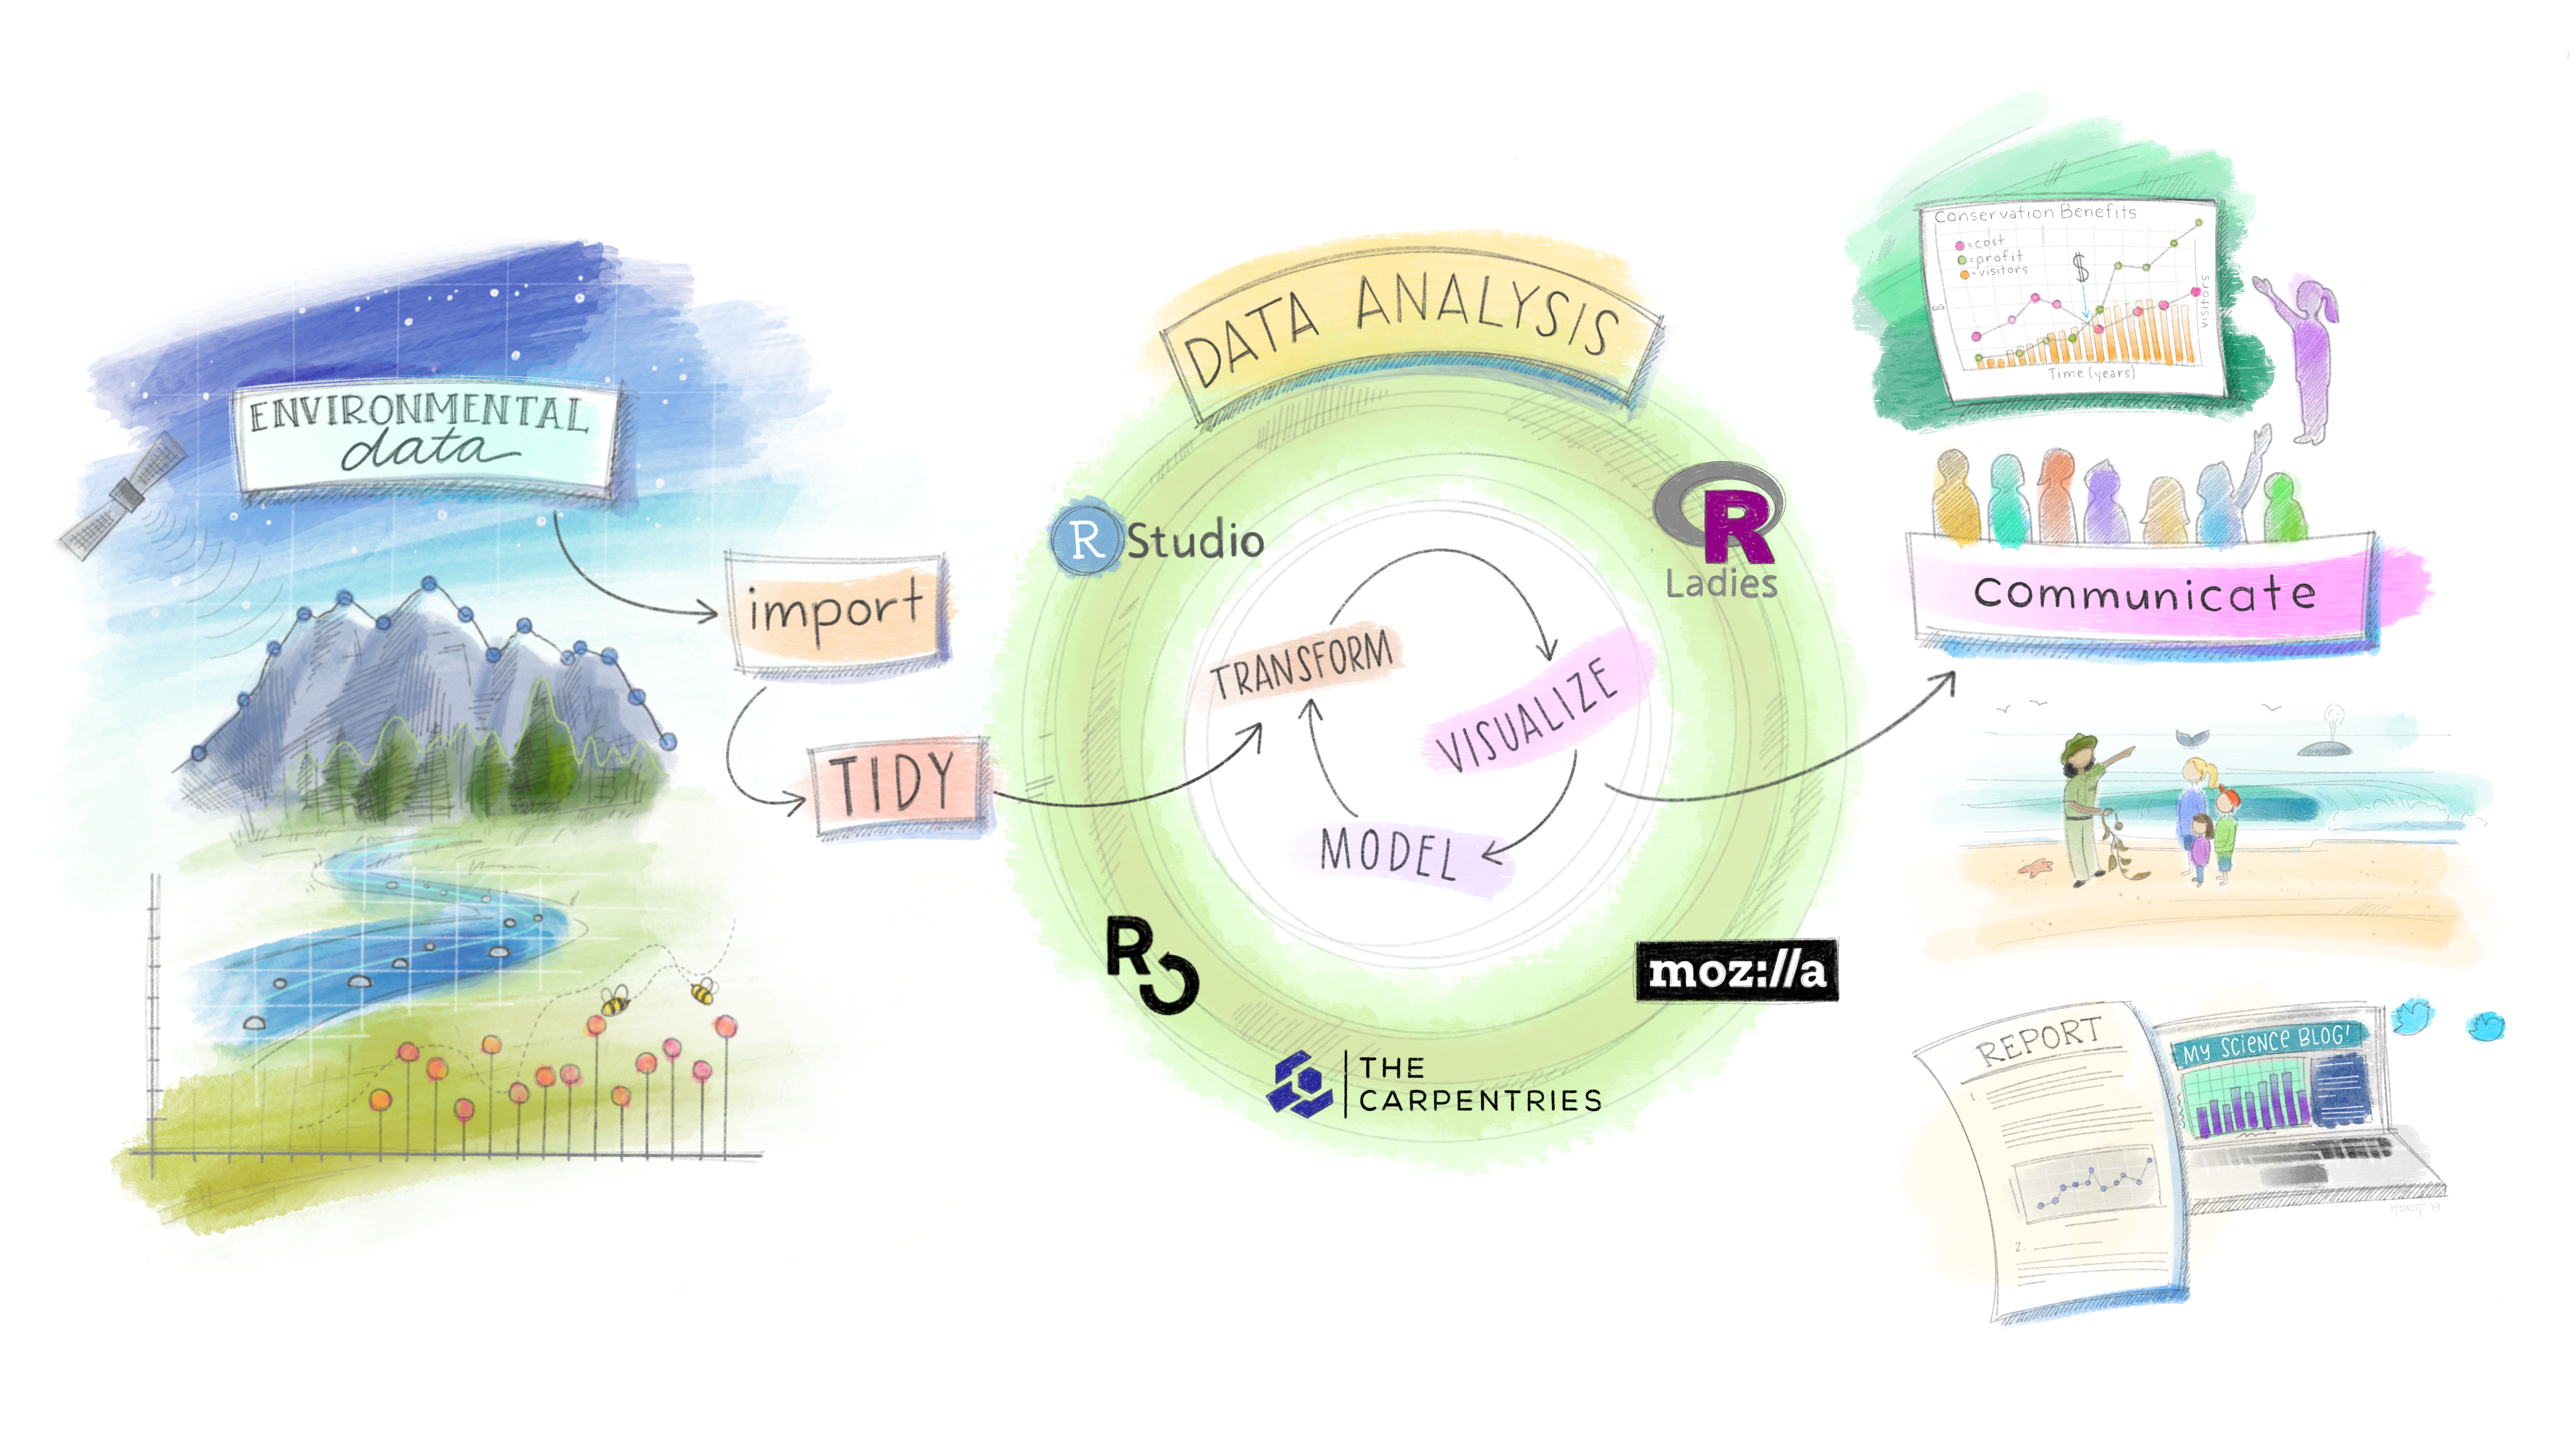
Artwork by Allison Horst

Course Description

Effectively communicating your work in a responsible, accessible and visually-pleasing way is a central part of data science. This course will focus on the basic principles for effective communication through data visualization and using programmatic tools and workflows for creating and sharing data visualizations with diverse audiences.

By the end of this course, learners should be able to:

  • Identify which types of visualizations are most appropriate for your data and your audience
  • Prepare (e.g. clean, explore, wrangle) data so that it’s appropriately formatted for building data visualizations
  • Build effective, responsible, accessible, and aesthetically-pleasing visualizations using the R programming language, and specifically {ggplot2} + ggplot2 extension packages
  • Write code from scratch and read and adapt code written by others
  • Apply a DEI (Diversity, Equity & Inclusion) lens to the process of designing data visualizations
  • Assess, critique, and provide constructive feedback on data visualizations

Teaching Team


Instructor

Sam Shanny-Csik
Email: scsik@ucsb.edu
Learn more: samanthacsik.github.io

TA

Annie Adams
Email: aradams@ucsb.edu
Learn more: annieradams.github.io

TA

Sloane Stephenson
Email: gstephenson@ucsb.edu

Acknowledgements

Building this course meant learning from the many incredible folks who think a lot about producing effective, beautiful, and responsible data visualizations. I relied heavily on the open source R / {ggplot2} / data viz teaching materials and tutorials that this wonderful data science community shares so willingly. Attribution will be included on any slides / materials where content is adapted from other educators.

This work is licensed under a Creative Commons Attribution 4.0 International License


This website is built with , and Quarto