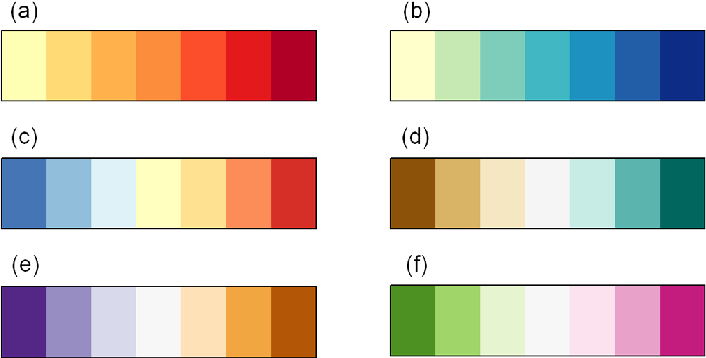
Fig 4 Appropriate diverging and sequential colour schemes for the following climate data (a), absolute temperature (b), absolute precipitation (c), temperature anomaly (d), precipitation or runoff anomaly (e and f) other climate variables with no symbolic association . Schemes in this figure are 7 class ones designed by Cynthia Brewer, (Brewer et al. 2003) - from Kaye, Hartley & Hemming (2012)
Pre-class Prep
A. Install required packages
install.packages("paletteer") # a comprehensive collection of color palettes in R using a common interface
install.packages("viridis") # Colorblind-Friendly Color Maps for R
install.packages("RColorBrewer") # ColorBrewer Palettes
install.packages("tigris") # for downloading and using Census TIGER/Line shapefiles in R
install.packages("sf") # provides simple features access in R
B. Download data
Save data to your class repo at EDS-240-class-examples/week5/data/:
| Lecture | Dataset title | Download link | Notes |
|---|---|---|---|
| 5.2 | County-level precipitation data (Nov 2020 - Oct 2025) for the contiguous U.S | Download the data from the NCEI County Mapping tool by clicking the CSV download button, located beneath the map. The previous link should take you to the correct subset of data, but triple check that the drop down boxes specify Contiguous U.S./Precipitation/2025/October/60-Month and that it says November 2020 - October 2025 Contiguous U.S. Coutny Precipitation above the provided table. In the event that the NCEI County Mapping tool is down, you can access a backup copy on Google Drive | NOAA’s National Centers for Environmental Information (NCEI) archives and provides access to terabytes of climate, coastal, oceanographic, and geophyscial data in a variety of formats |
C. Download .qmd templates & review data wrangling code
Download all necessary templates (links in the table below) and save them to a
EDS-240-data-viz-examples/week5/folder.Review the data wrangling code under the
## Setupsection of template 5.2 and make note of any questions you might have (no data wrangling necessary in template 5.1). Due to time constraints, we won’t be live-coding our way through the data wrangling code in class. However, we’ll reserve some time to answer any questions before we jump into data viz .
D. (OPTIONAL, but highly recommended) Install Google Chrome extensions
I’ll be using both of these (really wonderful and easy-to-use) tools during lecture and encourage you to install them:
- Let’s get color blind: simulates different color deficiencies in the browser
- Monochrome Mode: Grayscale browsing: turns websites grayscale
- ColorZilla: an Eyedropper, Color Picker, Gradient Generator (also available for Firefox)
Lecture Materials
| Lecture slides | Code-along template | Code-along key |
|---|---|---|
| Lecture 5.1: colors | 5.1 template | 5.1 key |
| Lecture 5.2: choropleth | 5.2 template | 5.2 key |
Pre-lab Prep
A.Bring a cool data viz!
This week’s lab section will be a time to explore, share, and discuss “non-standard” chart types, as well as those that present data using the fundamental chart types we’ve already discussed in different and exciting ways. Ahead of lab, find a cool data viz that uses a “non-standard” chart type.If you are having trouble finding one, check some of the resources on the course website.
B. (OPTIONAL) Get yourself a Bluesky account
Bluesky is quickly becoming the Twitter replacement for data science community members to connect, share, and learn together. You can stay up to date on #TidyTuesday submissions and follow many of the great data viz folks in the field. Check out the resources page for more information on how to get started.
Lab Materials
| Lab Slides | Exercise instructions | Exercise solutions |
|---|---|---|
| Lab 5 slides: beyond fundamental chart types | NA | NA |
Assignment Reminders
| Assignment Type | Assignment Title | Date Assigned | Date Due |
|---|---|---|---|
| FPM | Final Project Milestone #2 | Wed 01/28/2026 | Wed 02/04/2026, 11:59pm PT |
| SR | Mid-course reflection (SR #2) | Wed 02/04/2026 | Fri 02/06/2026, 11:59pm PT |
| HW | Homework #3 | Wed 02/04/2026 | Wed 02/11/2026, 11:59pm PT |