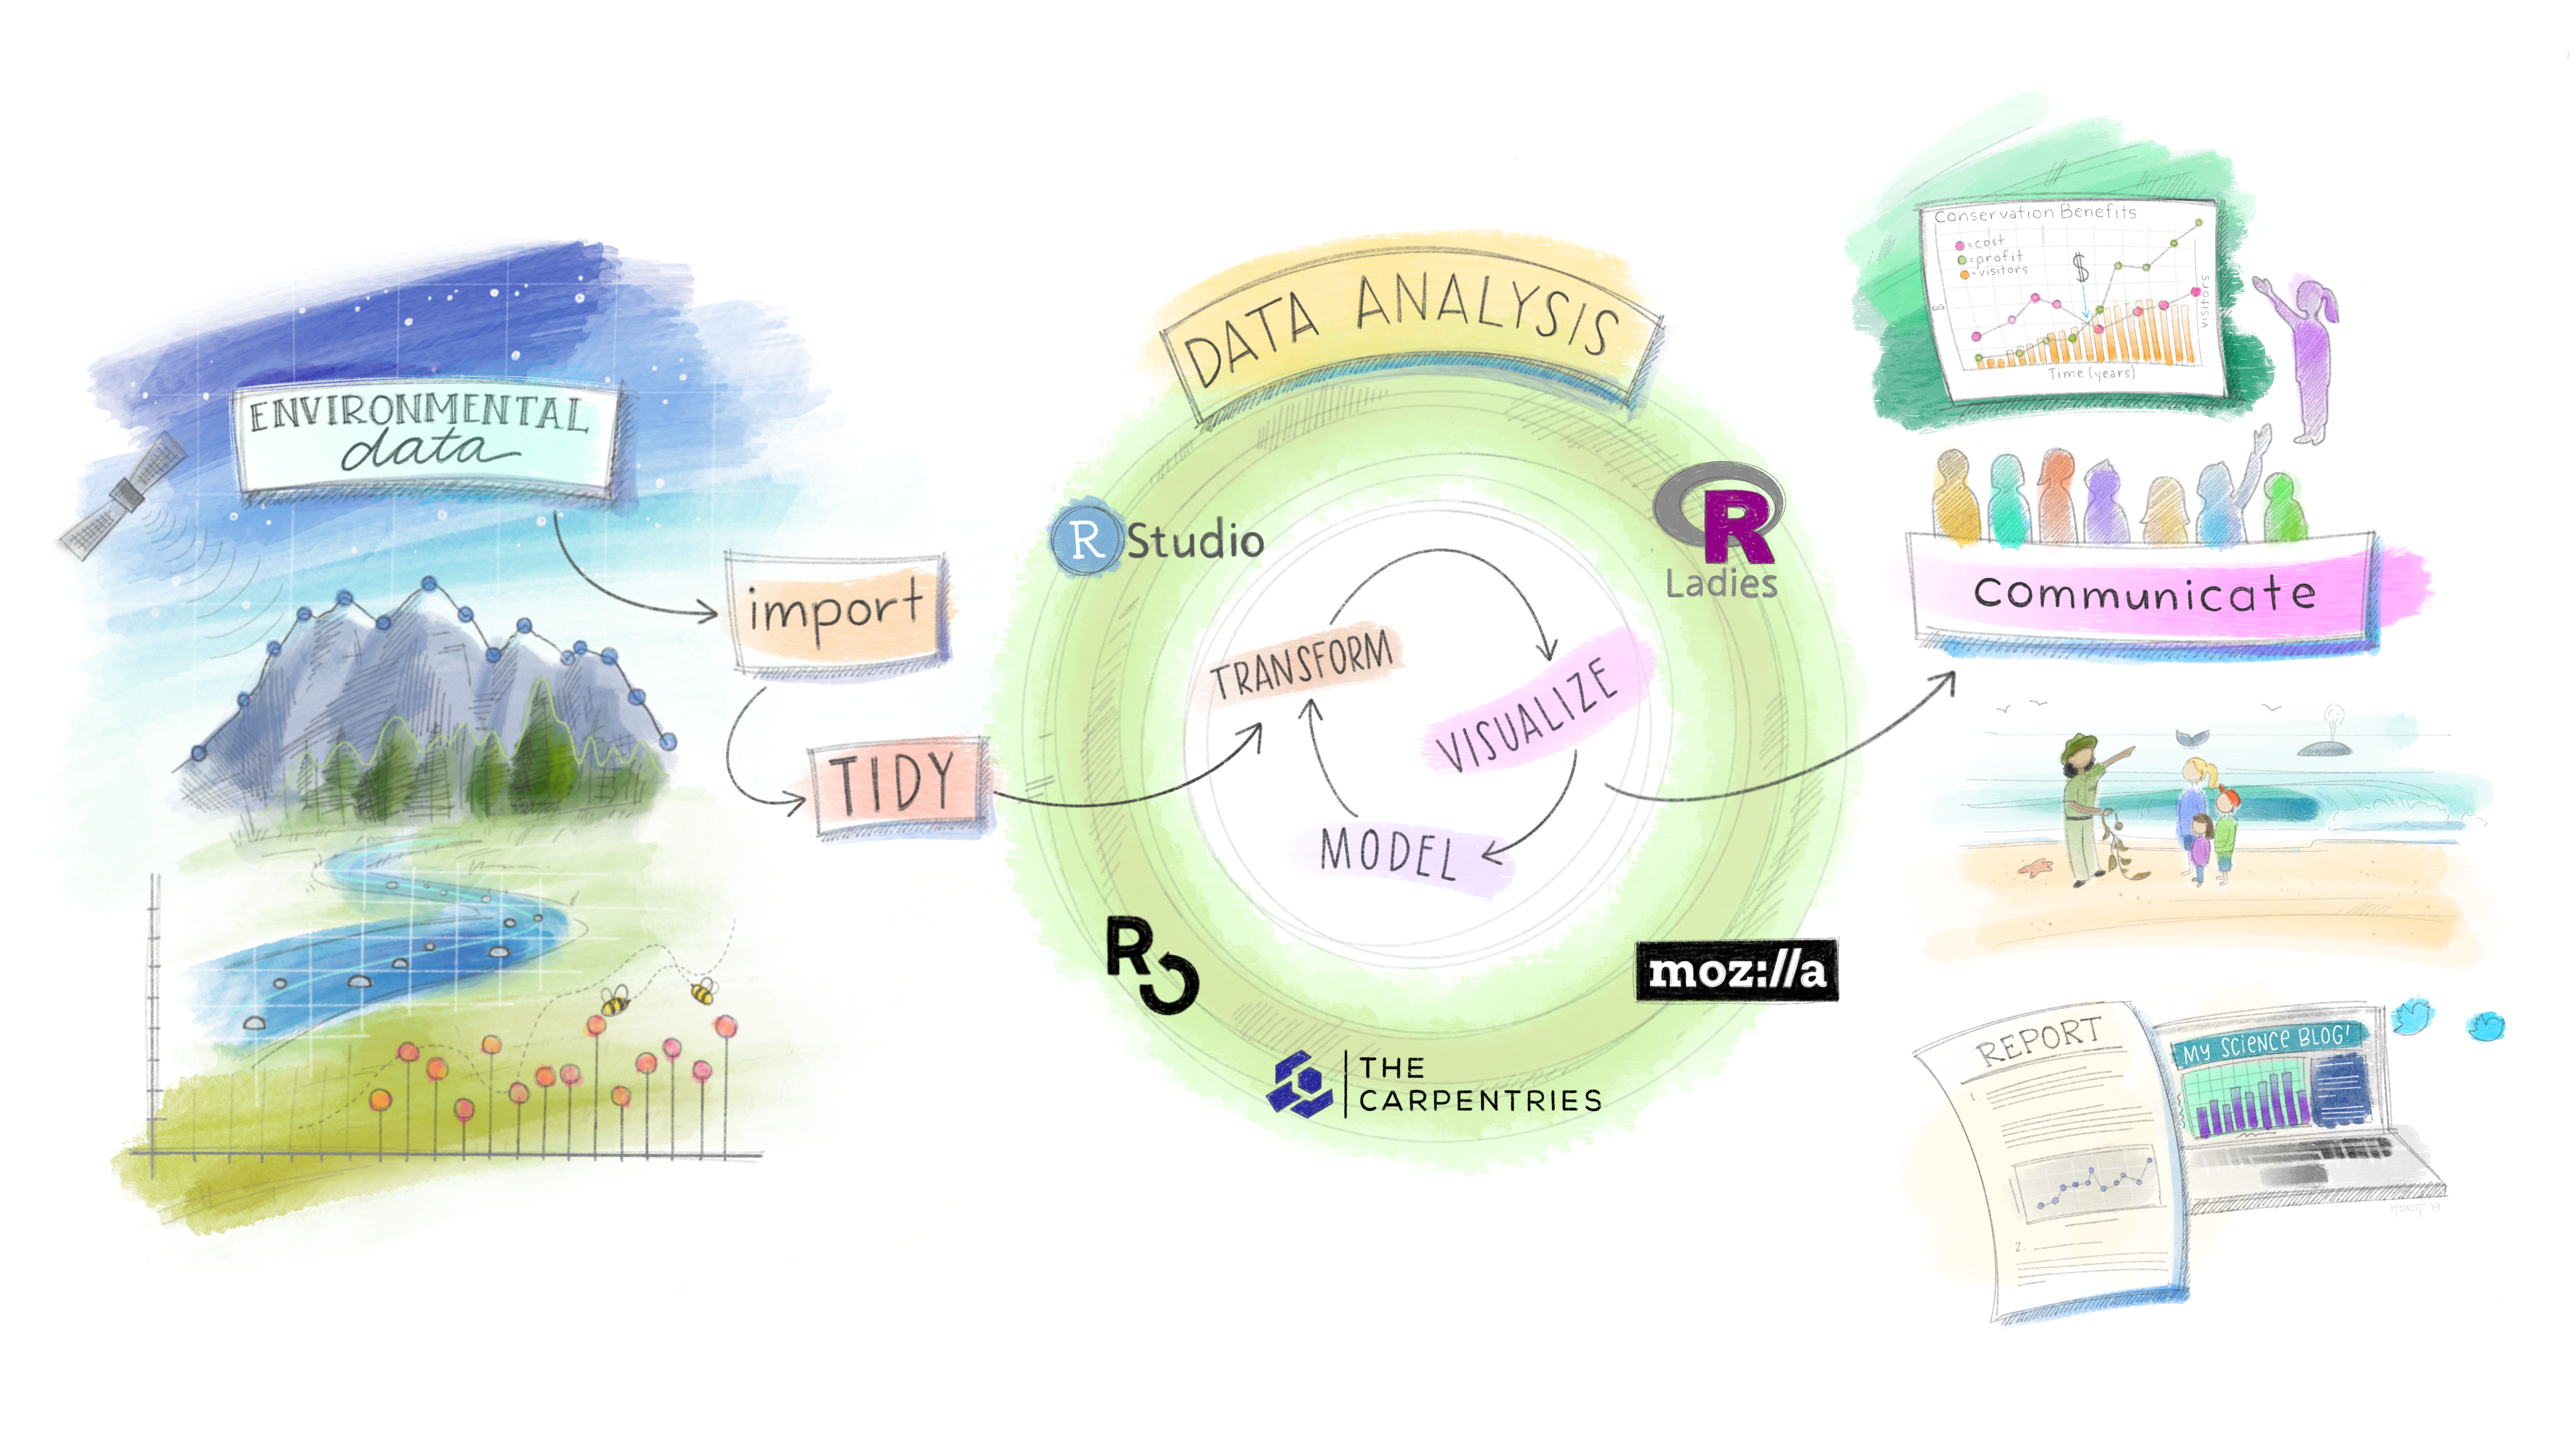
Artwork by Allison Horst
Pre-class Prep
No required prep for this week’s lecture!
Lecture Materials
| Lecture slides | Code-along template | Code-along key |
|---|---|---|
| Lecture 8.1: data storytelling | NA | NA |
| Lecture 8.2: people as data | NA | NA |
Pre-lab Prep
Similar to last week’s lab, we’ll be discussing progress on our data visualizations and providing constructive feedback to one another.
A. Prepare your data viz slide
Find your assigned slide from the Google Slide deck (see table, under the Lab Materials section, below) and add the following:
- (a different) one of your three visualizations (i.e. don’t choose the same viz that you brought to last lab section)
- the question that you’re visualization helps to answer
Lab Materials
| Lab Slides | Exercise instructions | Peer Feedback Form |
|---|---|---|
| Lab 8 slides: peer feedback | Google Slides | Peer Feedback Form |
Assignment Reminders
| Assignment Type | Assignment Title | Date Assigned | Date Due |
|---|---|---|---|
| FPM | Final Project Milestone #3 | Wed 02/11/2026 | Sun 02/22/2026, 11:59pm PT |
| FPM | Final Project Milestone #4 | Wed 02/25/2026 | Sun 03/08/2026, 11:59pm PT |