library(ggplot2)
library(palmerpenguins)
ggplot(data = penguins, aes(x = body_mass_g, fill = species)) +
geom_histogram(alpha = 0.5,
position = "identity") +
scale_fill_manual(values = c("darkorange","purple","cyan4")) +
labs(x = "Body mass (g)",
y = "Frequency",
title = "Penguin body masses")
It’s up to you to organize your own week3-discussion.qmd
file (i.e. there is no template). You may (should) discuss and work through today’s exercise with a partner (or two!).
Example 1: {palmerpenguins}
ggplot
- Copy the following code into your
week3-discussion.qmd
file and add code chunk options that:- render the output (i.e. plot), but not the code
- suppress any warnings or messages
- Add alt text using the
fig-alt:
code chunk option - “Inspect” your plot (right click > Inspect) to verify that the
alt
attribute and text is added to the HTML
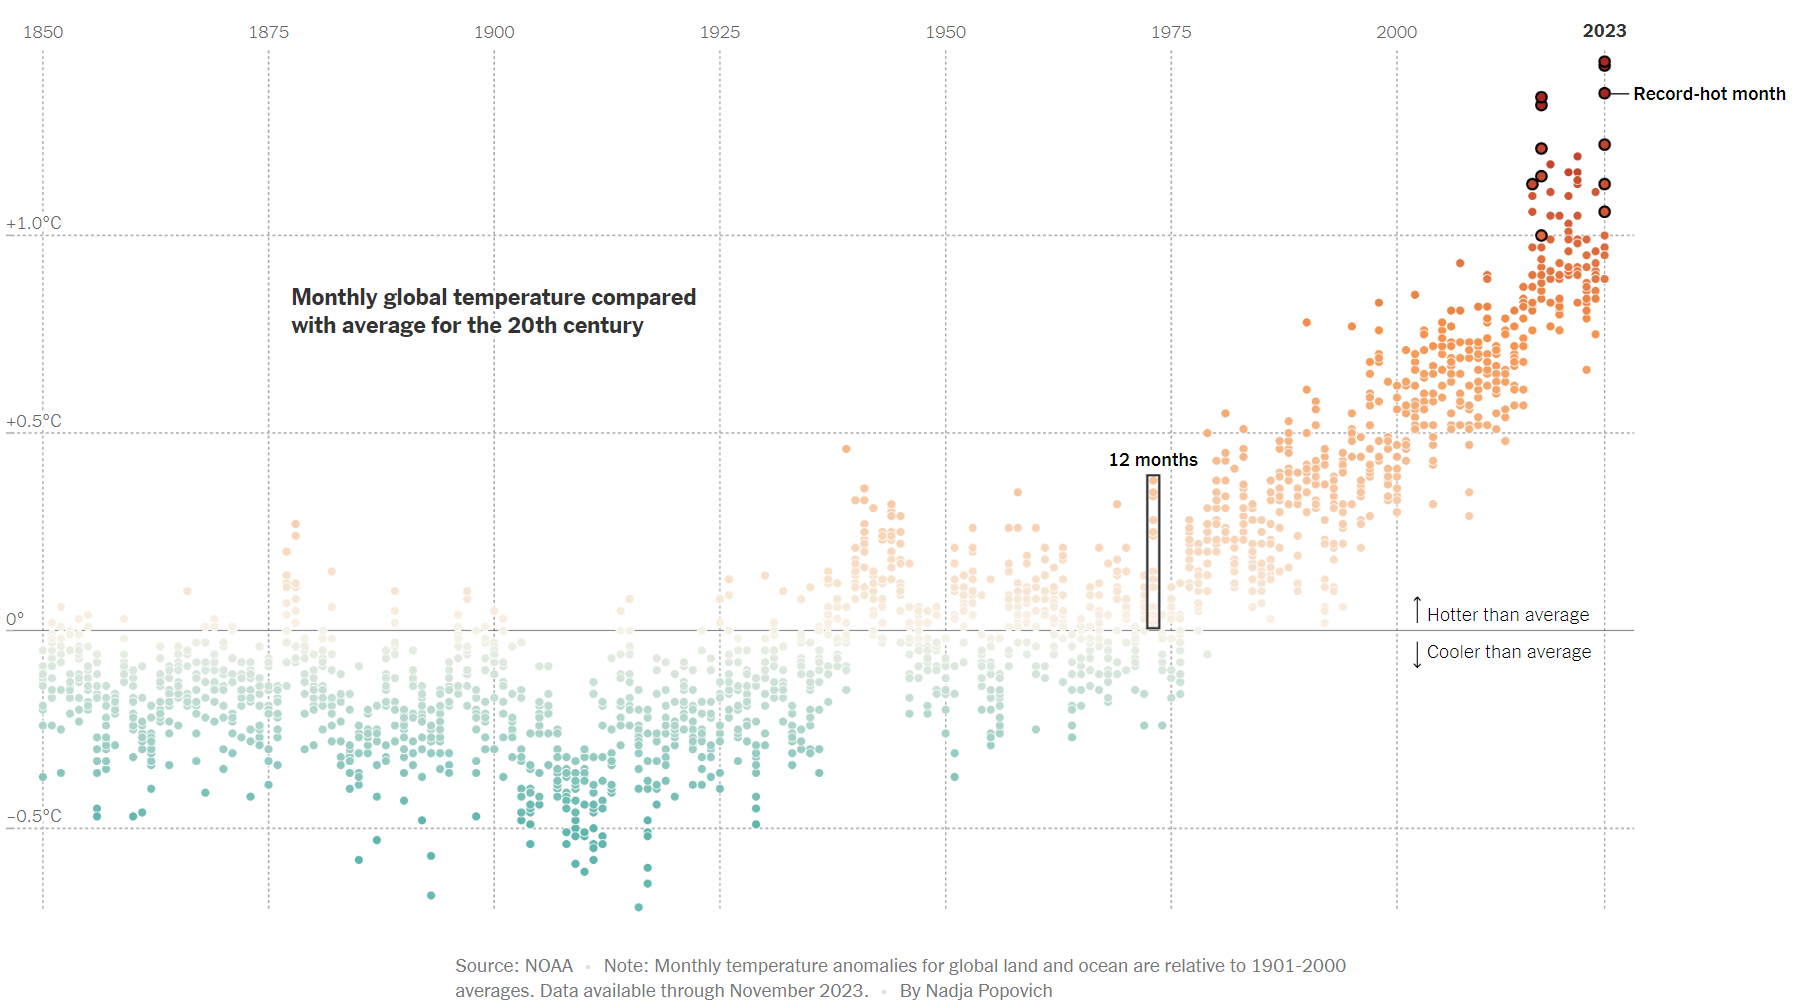
Example 2 (from The New York Times):
- Download this viz (right click > Save Image As… > save to your class repo)
- Embed the viz in
week3-discussion.qmd
using Markdown syntax and add alt text:
![](file/path/to/your/image){fig-alt="Alt text goes here"}
- “Inspect” your image (right click > Inspect) to verify that the
alt
attribute and text is added to the HTML
This graphic form is called a dot plot.
Dot plots are particularly useful for visualizing variability within a single measured numerical variable – here, that’s how much temperature deviates from the 20th-century average for each month in a given year. Year is treated as a categorical variable.
It’s easy to confuse dot plots with scatter plots, which alternatively are used to visualize a relationship between two (or sometimes three) numeric variables.
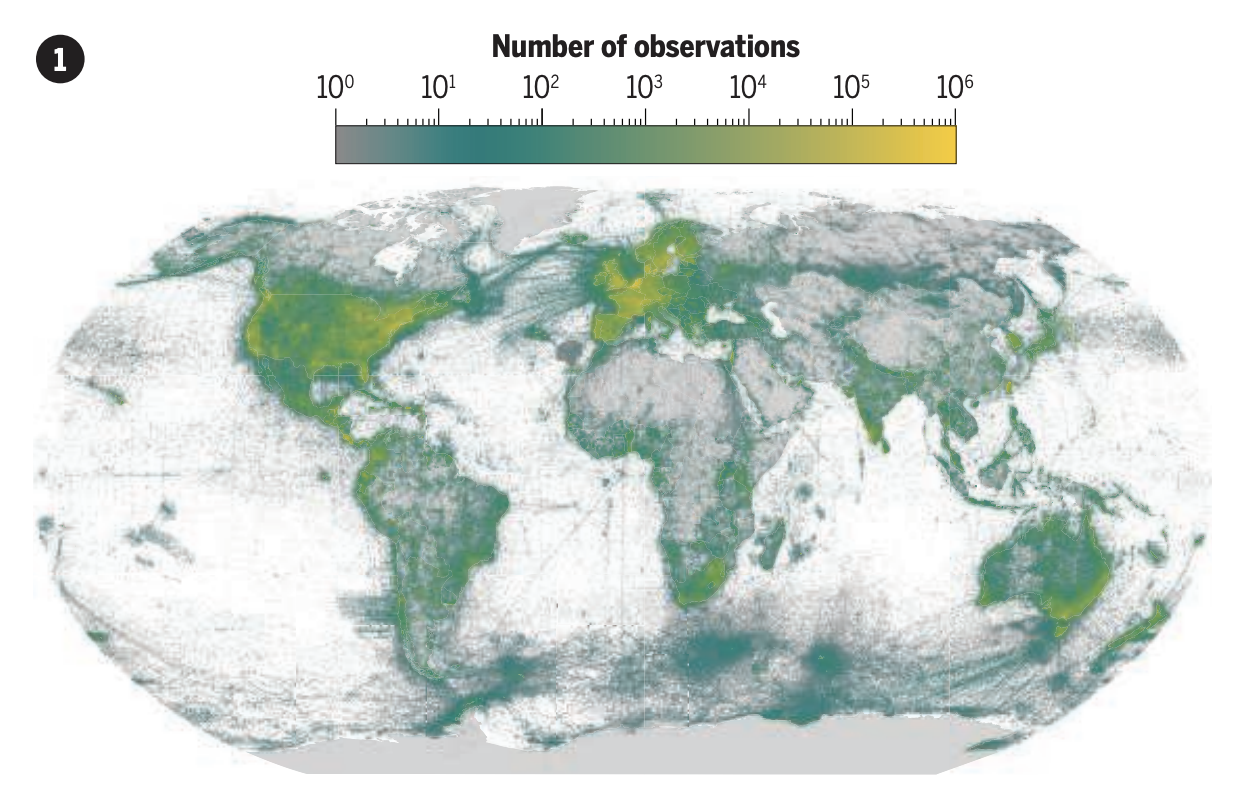
Example 3 (Fig 1A from Chapman et al. 2024):
- Download this viz (right click > Save Image As… > save to your class repo)
- Embed the viz in
week3-discussion.qmd
using HTML syntax and add alt text (you’ll also need to include thewidth
attribute to make the image a bit smaller):
<img src="file/path/to/image" alt="Alt text goes here" width="700px">
- “Inspect” your image (right click > Inspect) to verify that the
alt
attribute and text is added to the HTML
The associated figure caption for this figure:
The >2.6 billion species observations in the Global Biodiversity Information Facility (GBIF) database are disproportionately from high-income countries.