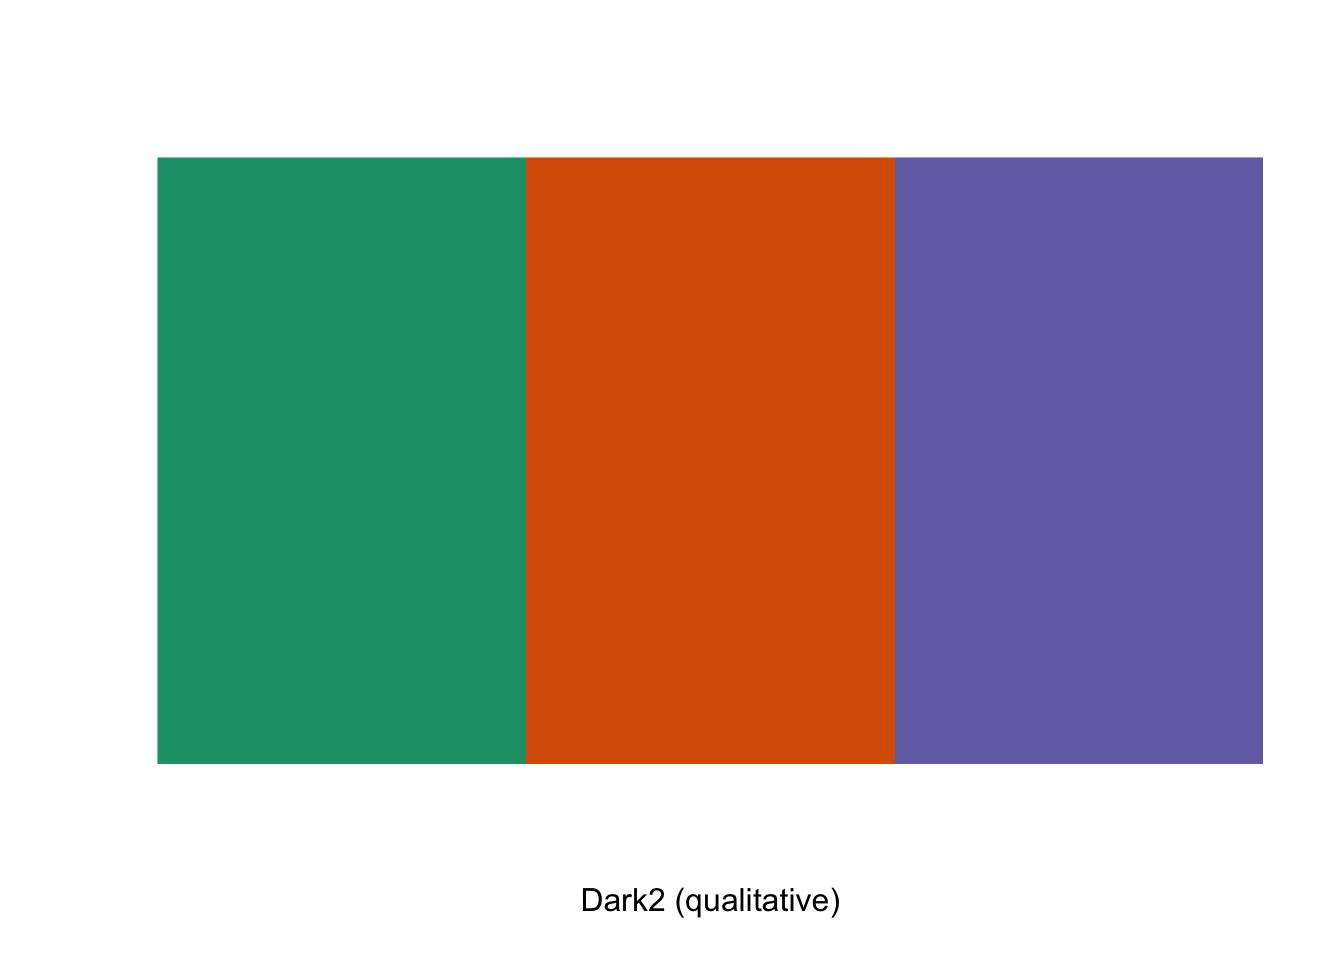
[1] "#1B9E77" "#D95F02" "#7570B3"This template follows the colors lecture. Please be sure to cross-reference the slides, which contain important information and additional context!
##~~~~~~~~~~~~~~~~~~~~~~~~~~~~~~~~~~~~~~~~~~~~~~~~~~~~~~~~~~~~~~~~~~~~~~~~~~~~~~
## setup ----
##~~~~~~~~~~~~~~~~~~~~~~~~~~~~~~~~~~~~~~~~~~~~~~~~~~~~~~~~~~~~~~~~~~~~~~~~~~~~~~
#..........................load packages.........................
library(palmerpenguins)
library(tidyverse)
##~~~~~~~~~~~~~~~~~~~~~~~~~~~~~~~~~~~~~~~~~~~~~~~~~~~~~~~~~~~~~~~~~~~~~~~~~~~~~~
## create base plots ----
##~~~~~~~~~~~~~~~~~~~~~~~~~~~~~~~~~~~~~~~~~~~~~~~~~~~~~~~~~~~~~~~~~~~~~~~~~~~~~~
#................requires categorical color scale................
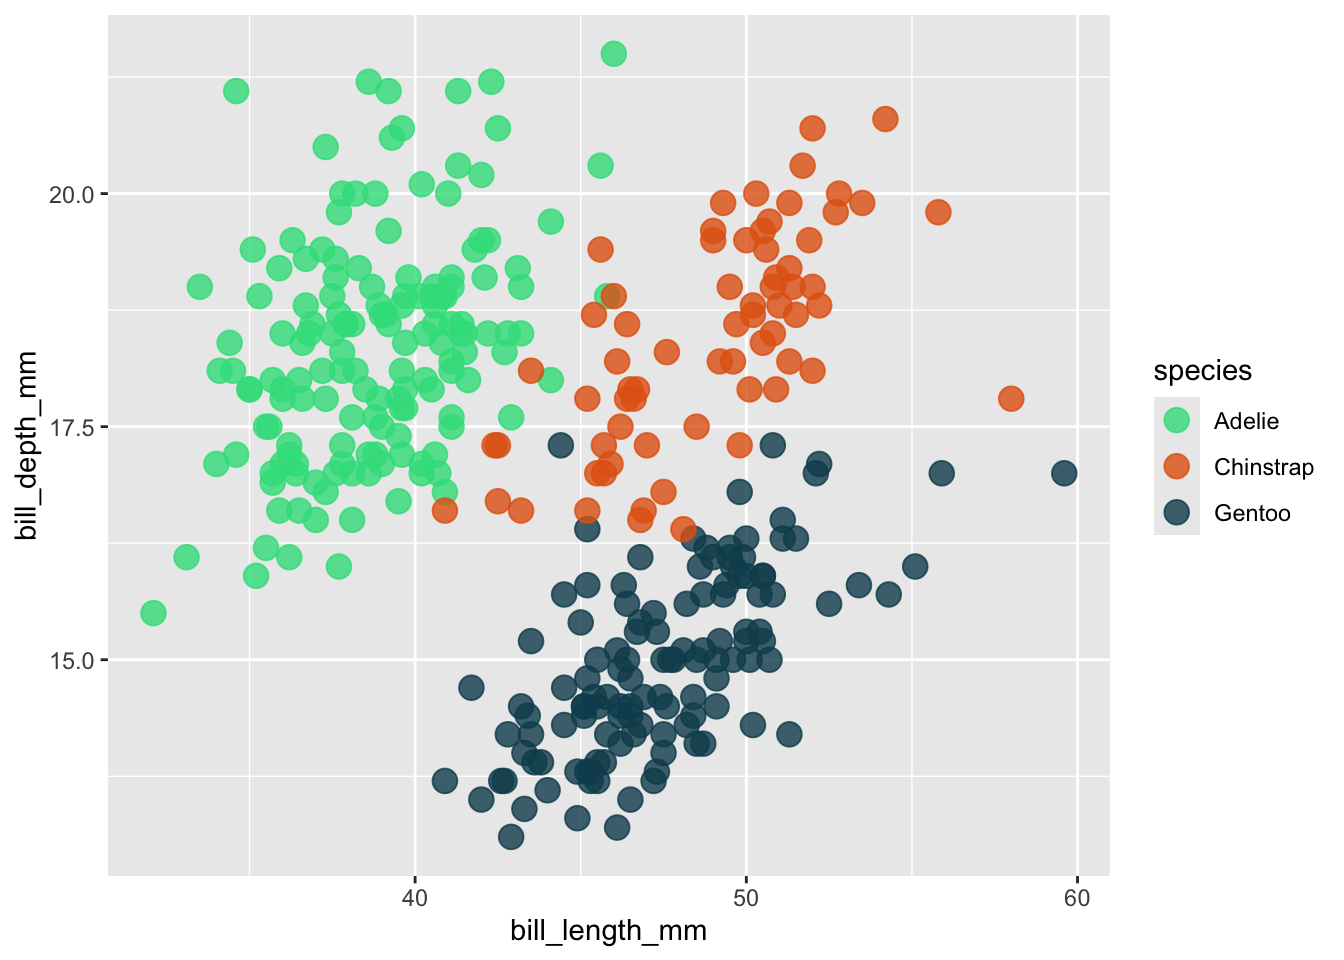
cat_color_plot <- ggplot(na.omit(penguins),
aes(x = bill_length_mm, y = bill_depth_mm,
color = species, shape = species)) +
geom_point(size = 4, alpha = 0.8)
cat_color_plot
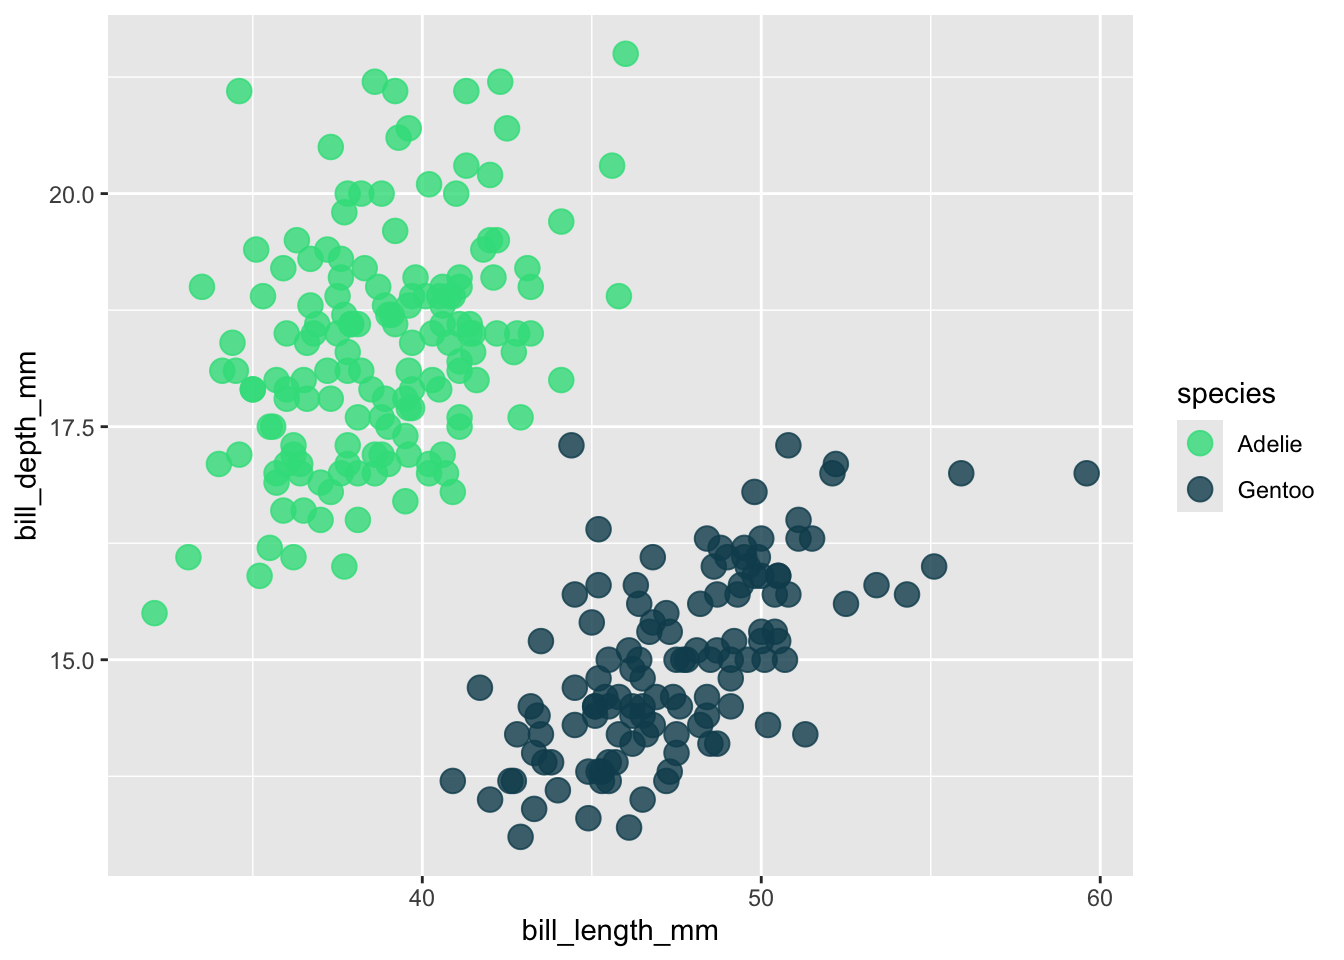
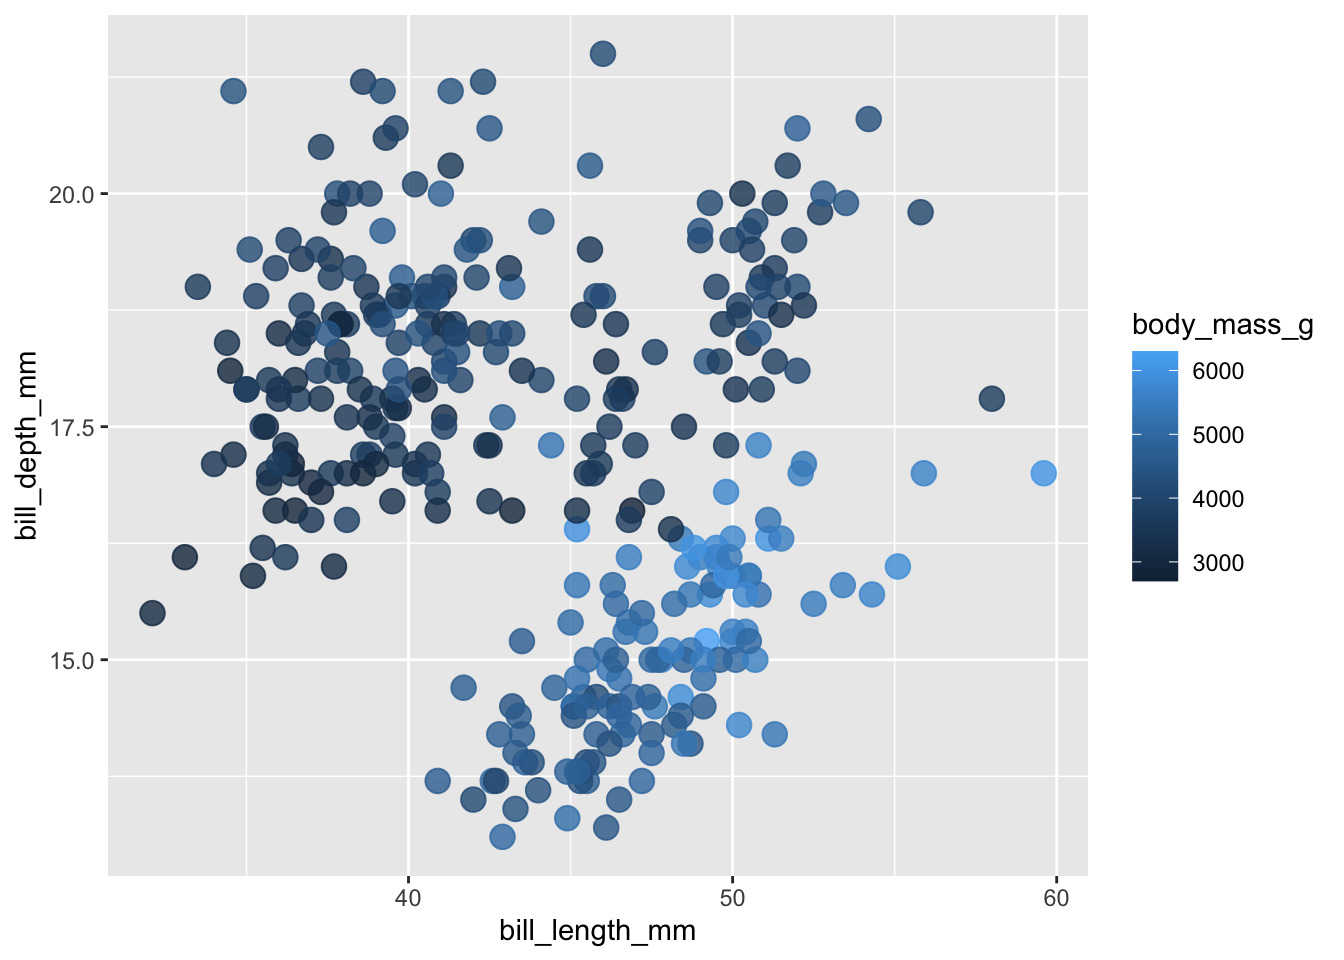
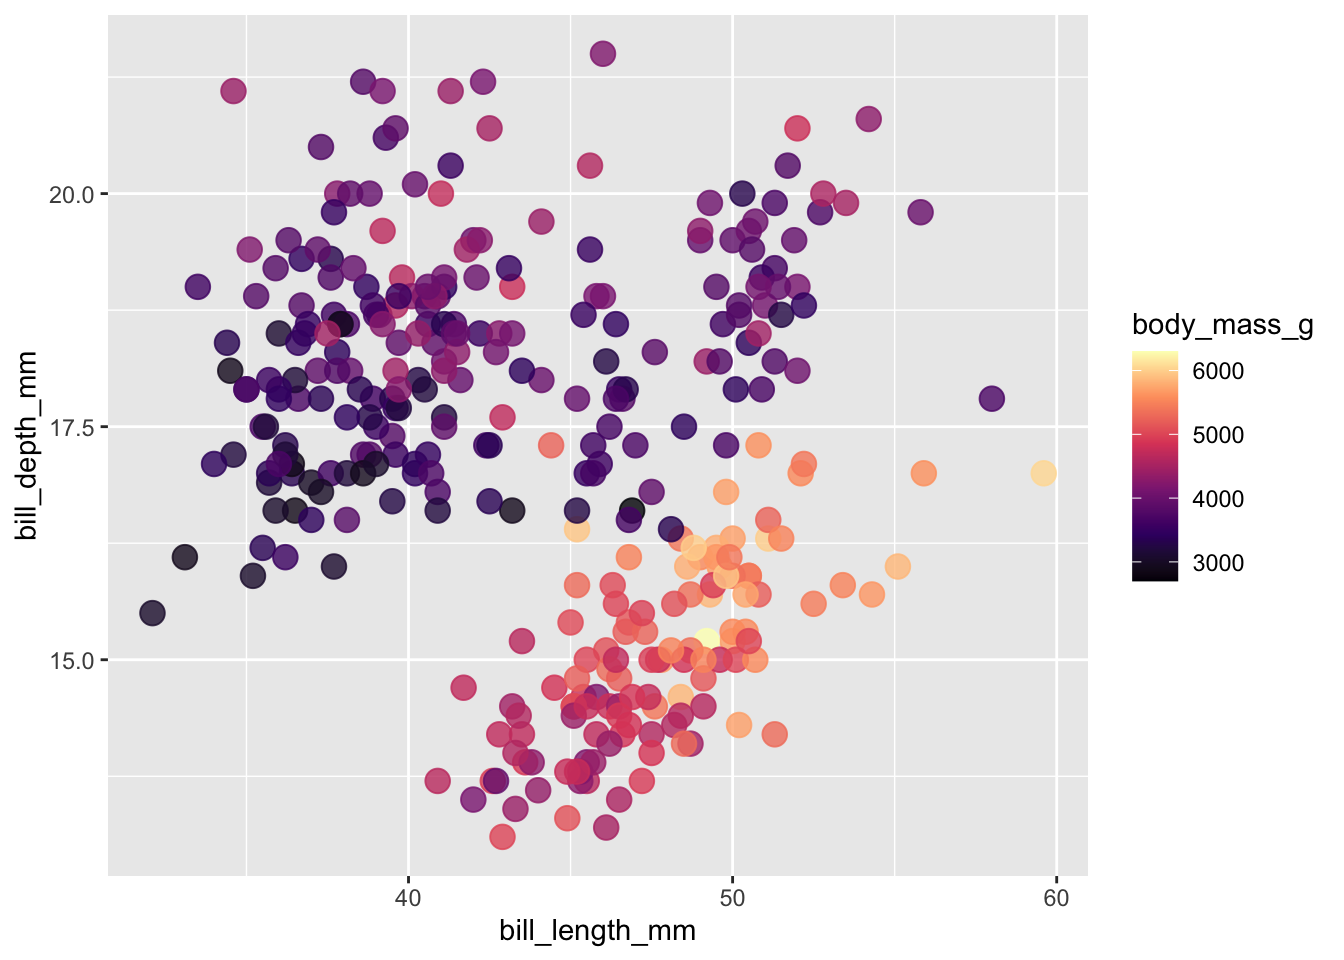
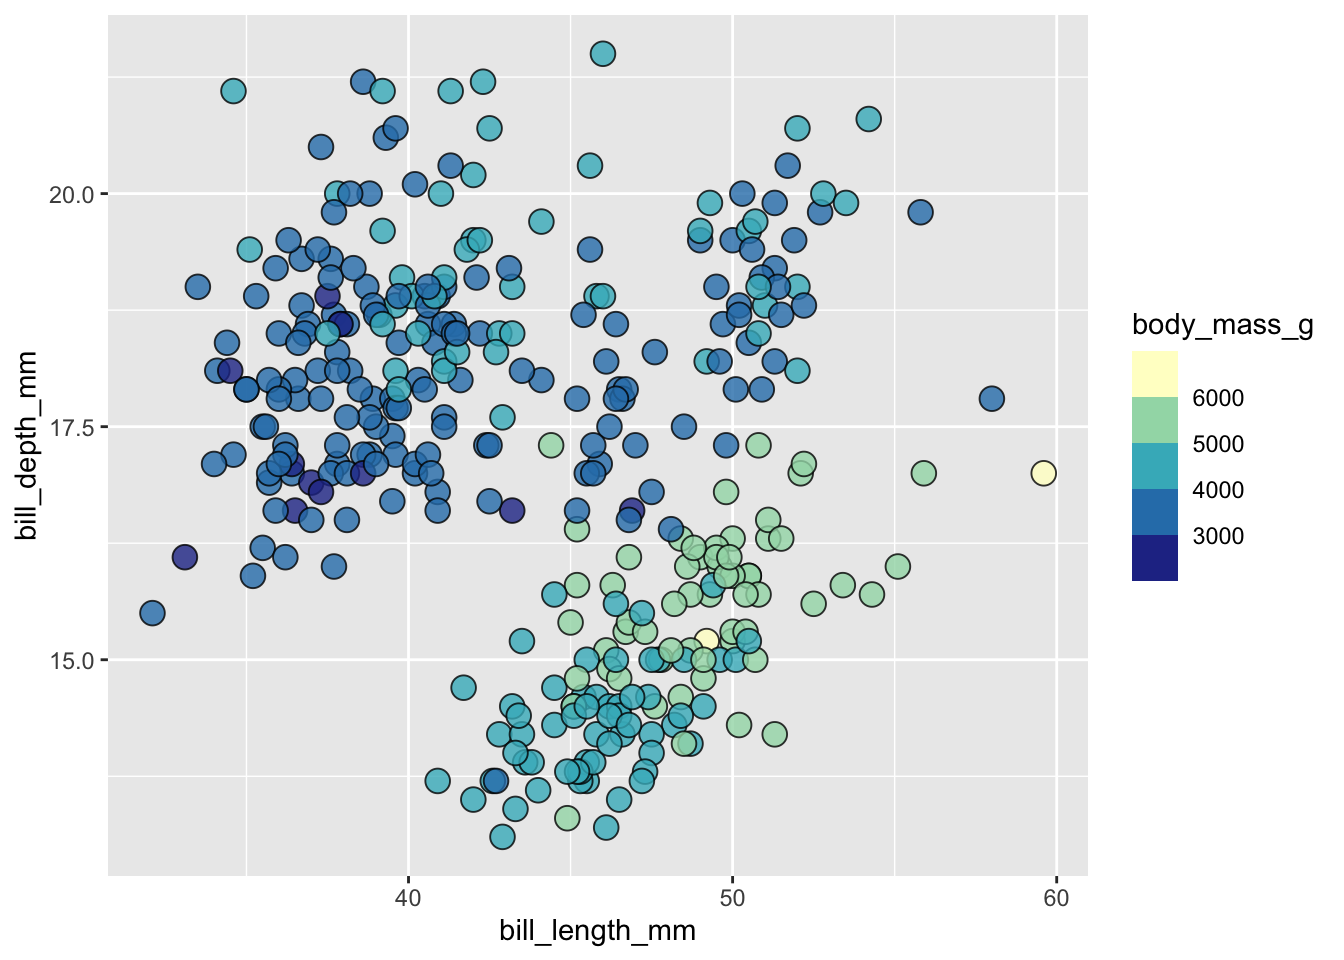
#................requires continuous color scale.................
con_color_plot <- ggplot(na.omit(penguins),
aes(x = bill_length_mm, y = bill_depth_mm,
color = body_mass_g)) +
geom_point(size = 4, alpha = 0.8)
con_color_plot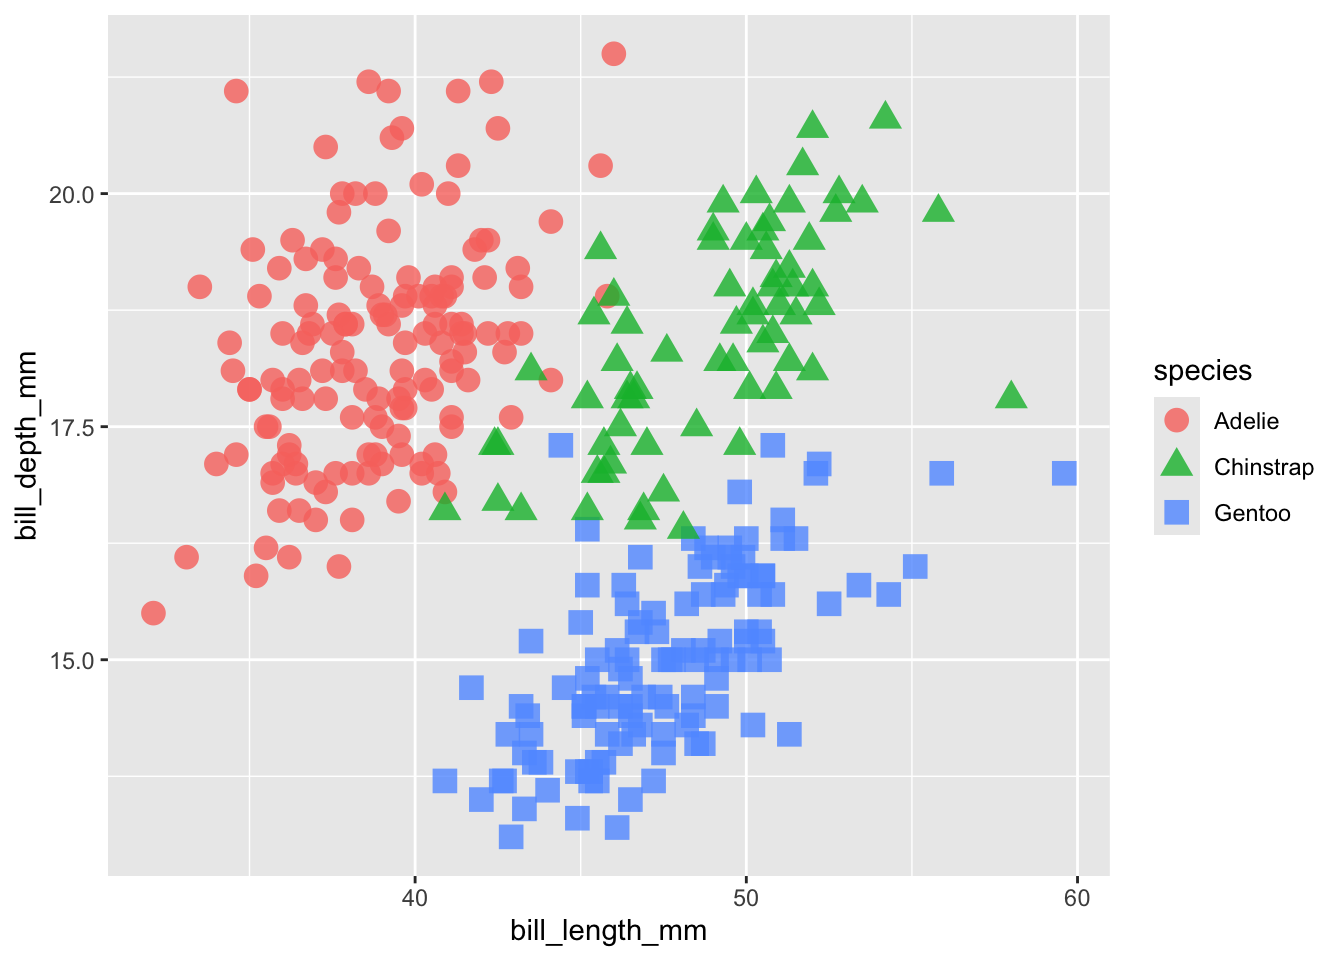
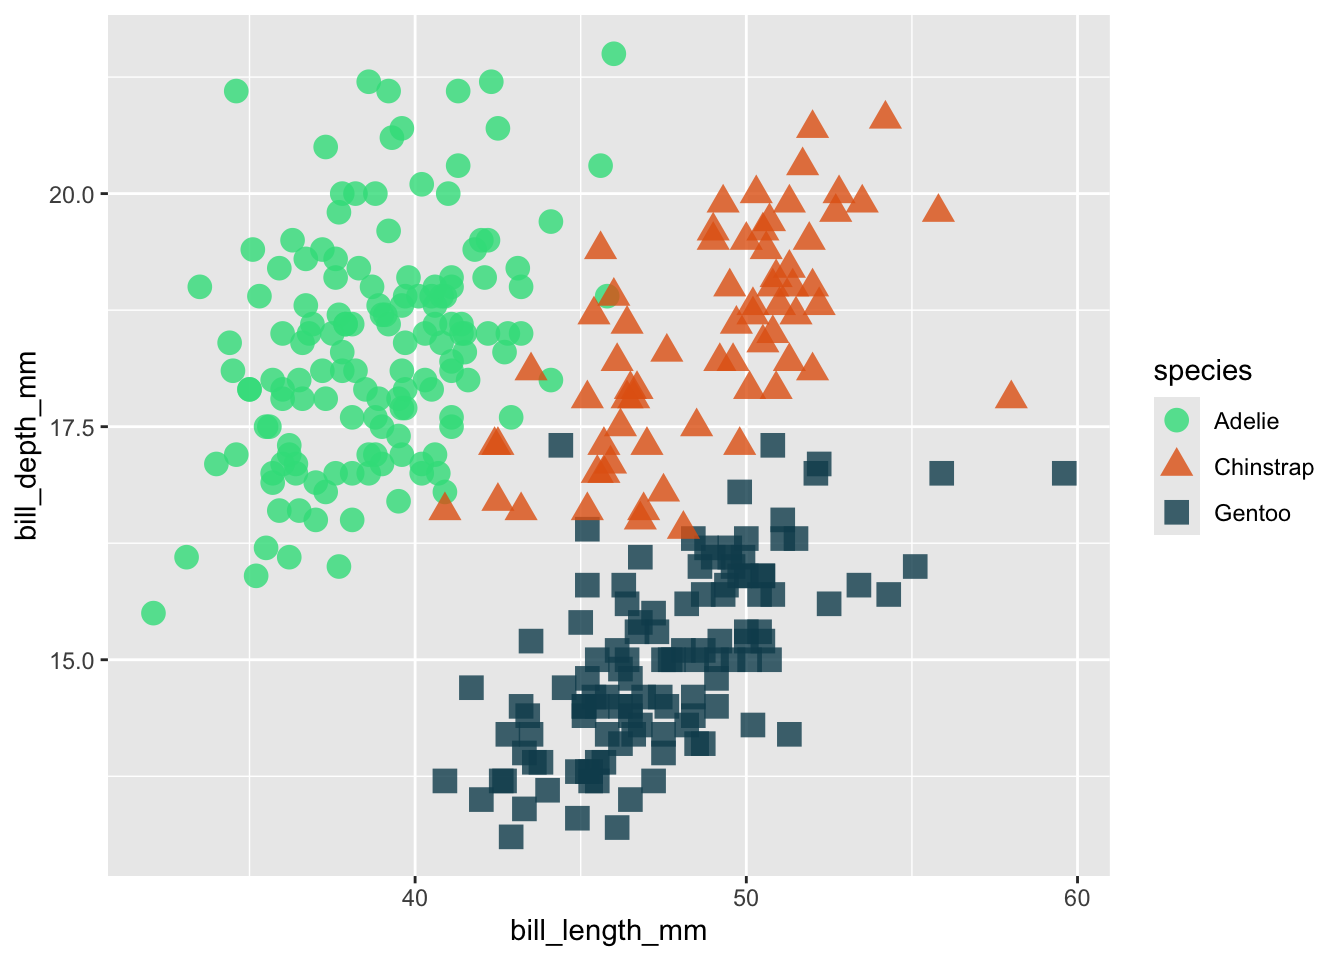
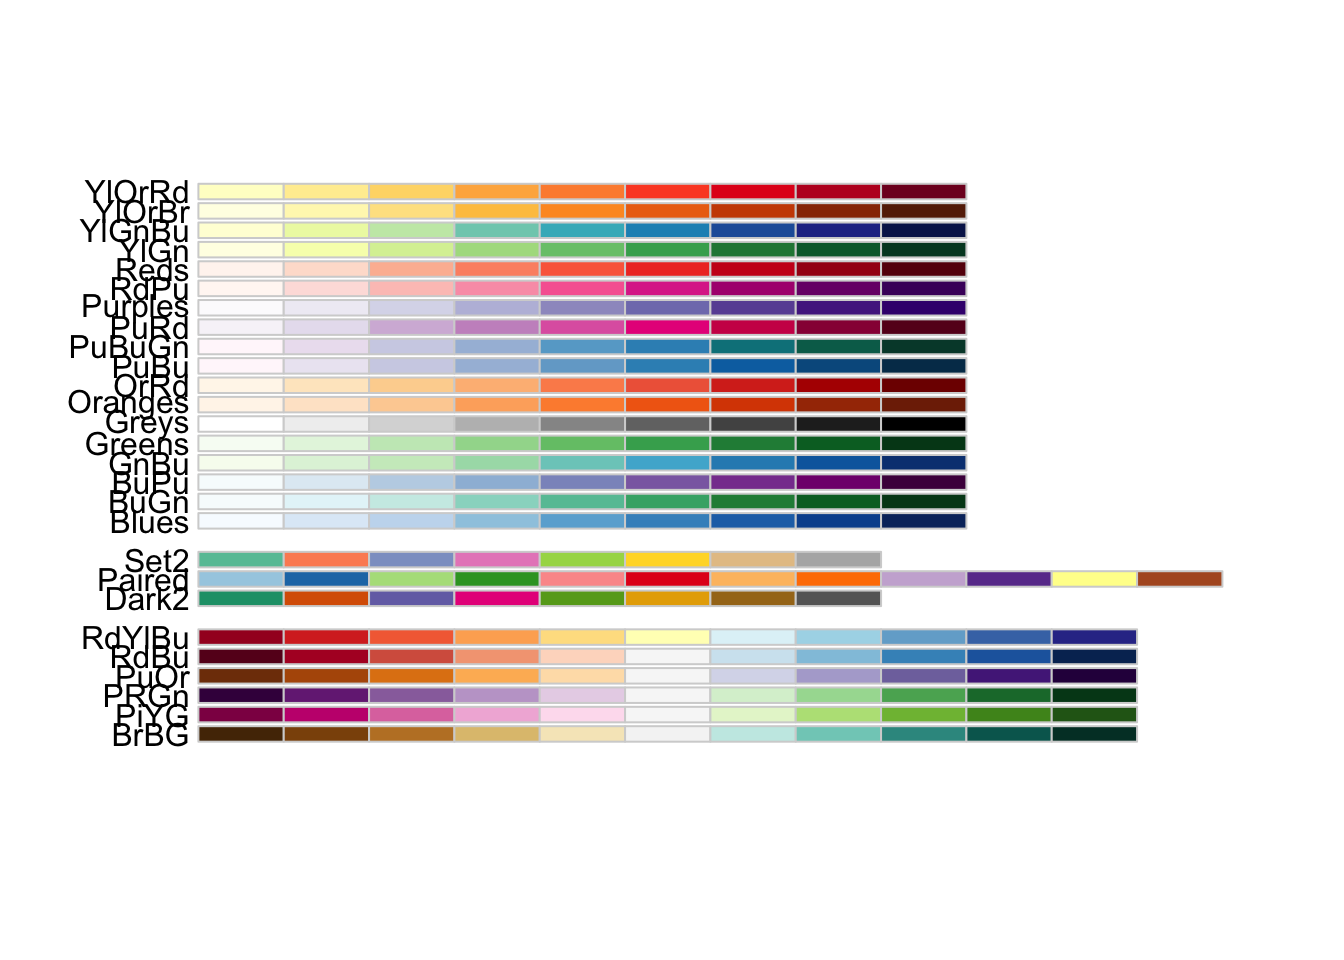
[1] "#1B9E77" "#D95F02" "#7570B3"#....................for qualitative palettes....................
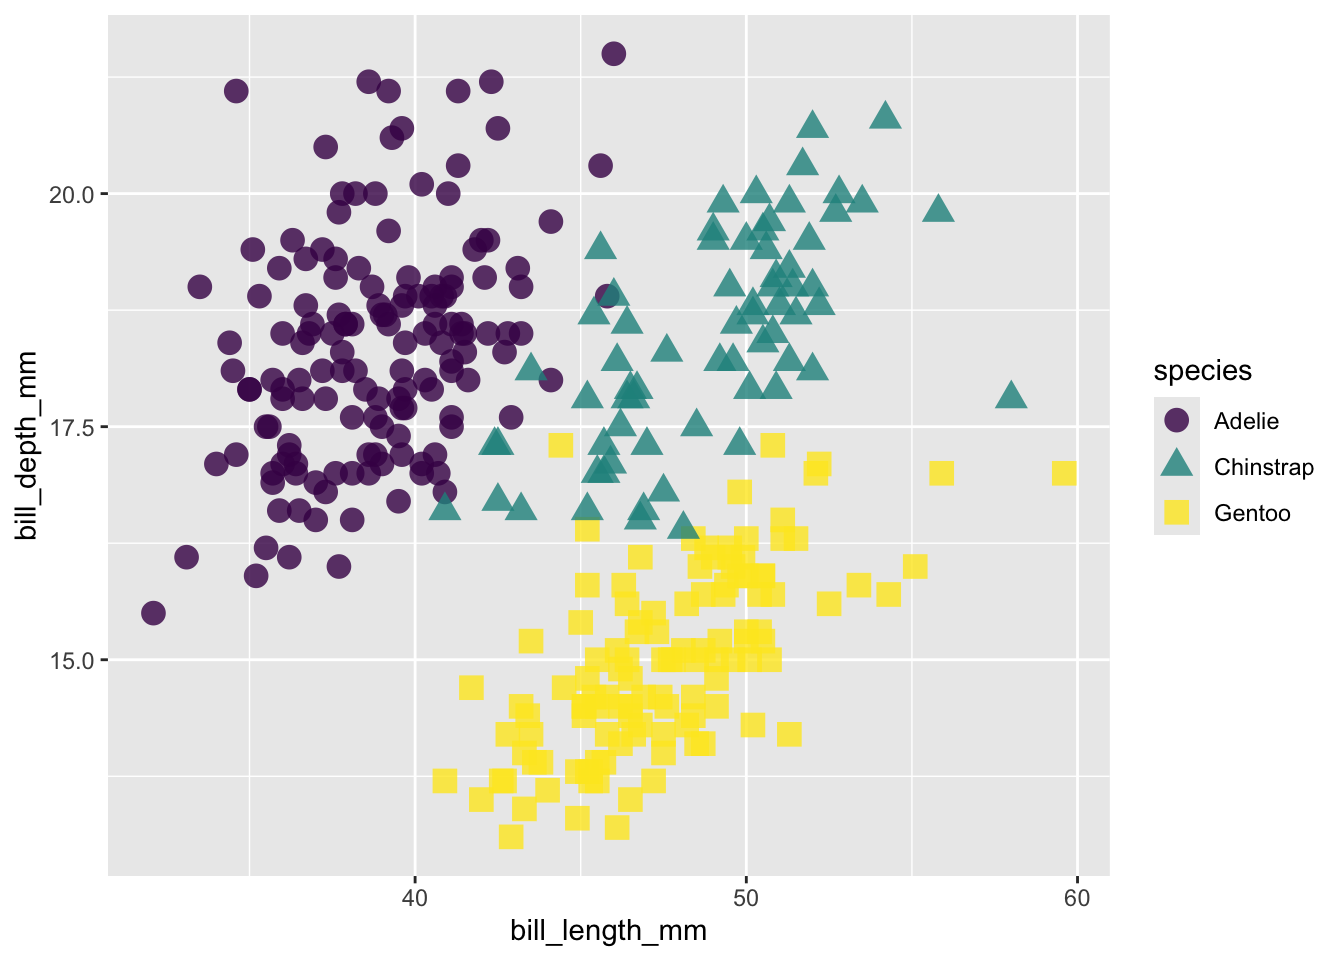
# Accessibility tip: use redundant mapping (e.g. colors + shapes) whenever possible
cat_color_plot +
scale_color_brewer(palette = "Dark2")
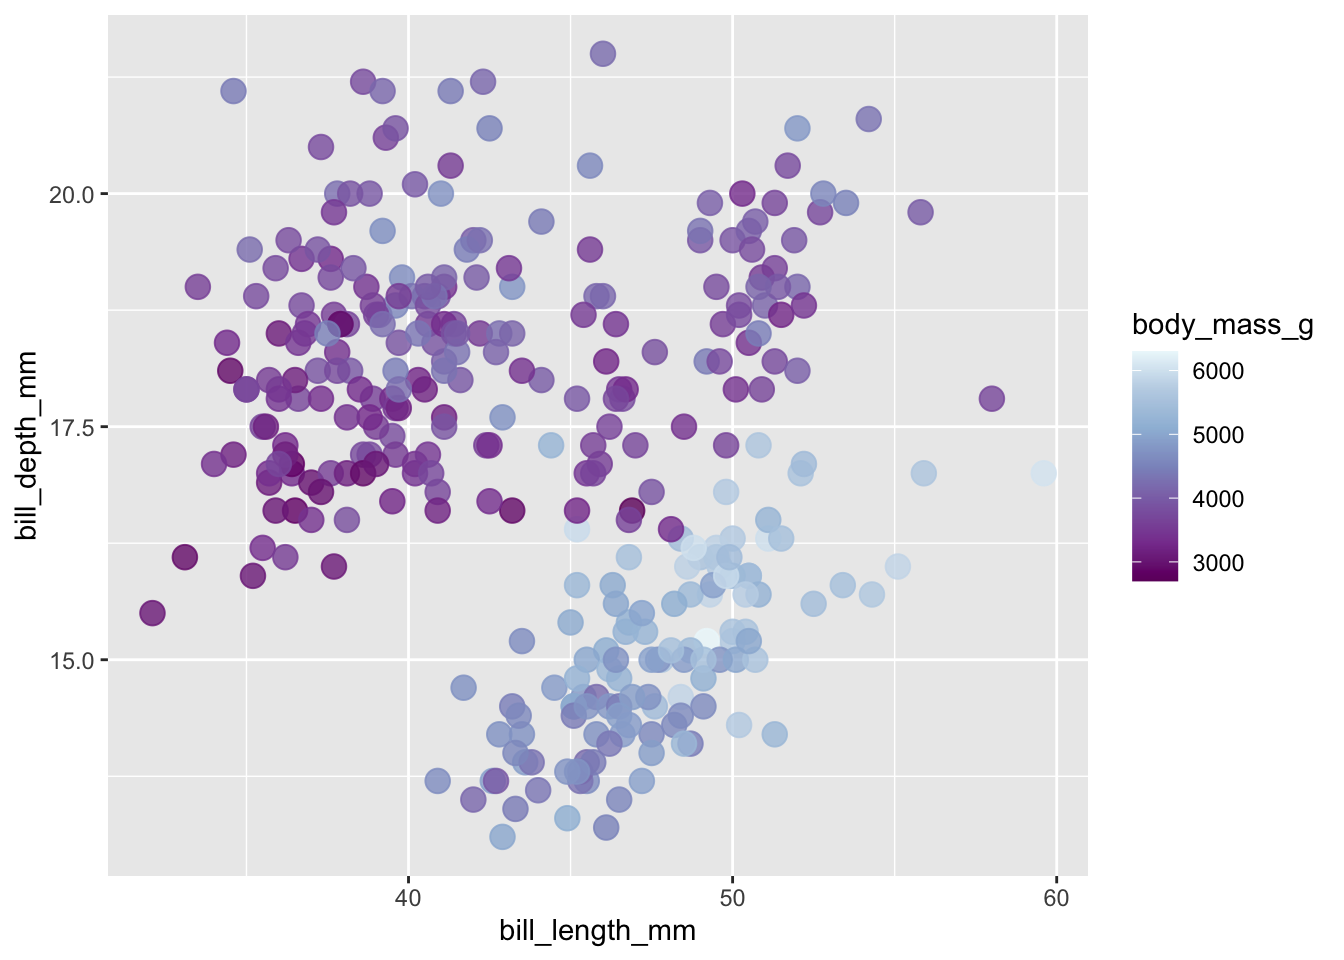
#..............for unclassed continuous color scales.............
con_color_plot +
scale_color_distiller(palette = "BuPu")
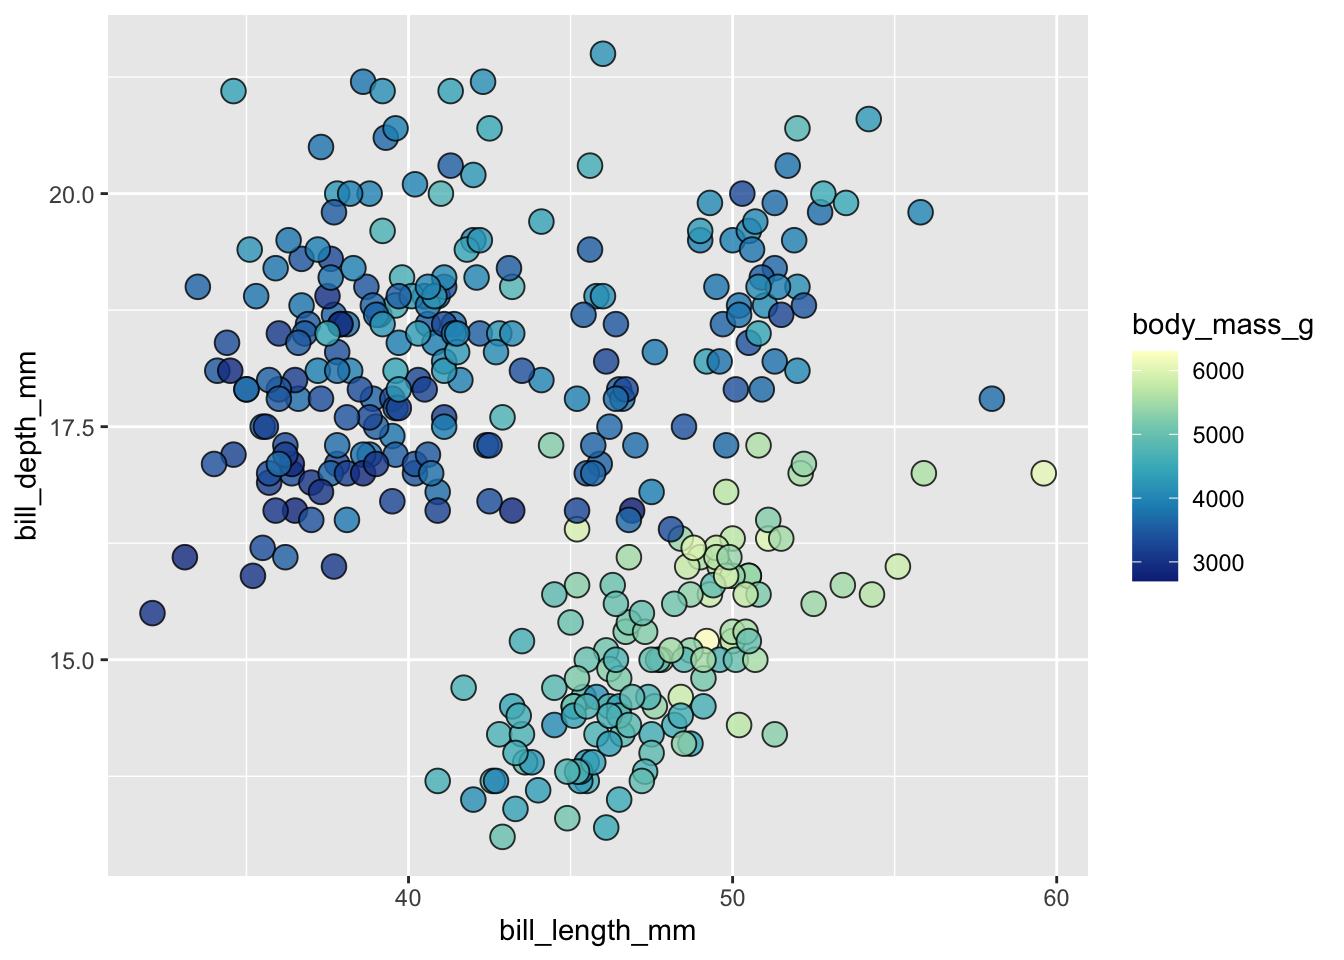
#..............for classed continuous color scales...............
con_color_plot +
scale_color_fermenter(palette = "YlGnBu")
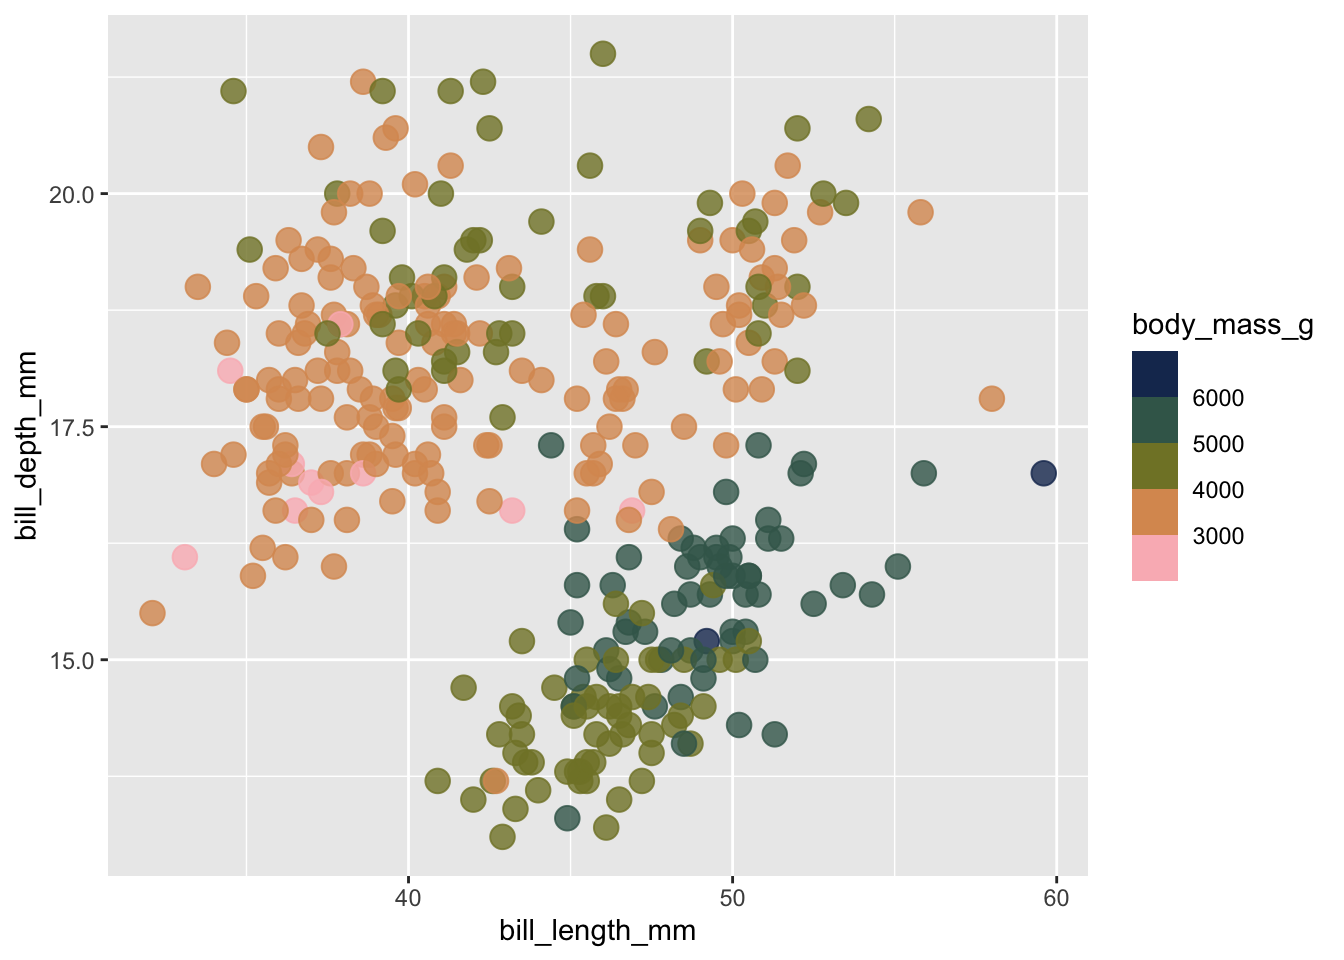
# Accessibility tip: outline points to make light colors more visible
ggplot(penguins, aes(x = bill_length_mm, y = bill_depth_mm, fill = body_mass_g)) + # notice switch from `color` > `fill`
geom_point(shape = 21, size = 4, alpha = 0.8) + # notice point `shape`
scale_fill_fermenter(palette = "YlGnBu")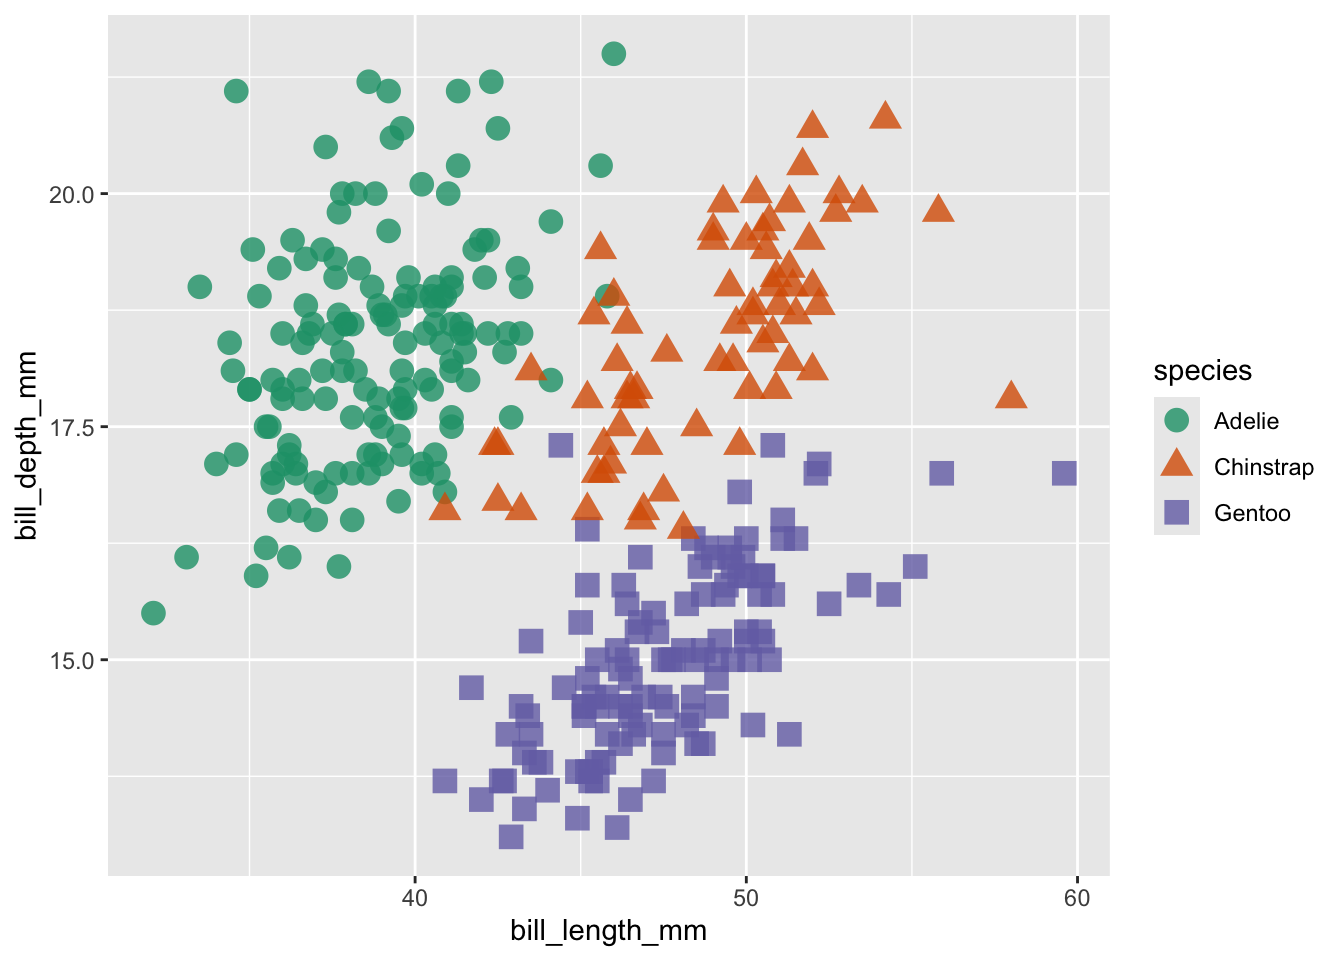
{paletteer}A few different ways to use {paletteer} palettes, but my preferred approach takes two steps:
paletteer_*()ggplot::scale_*() function<colors>
#F1BB7BFF #FD6467FF #5B1A18FF 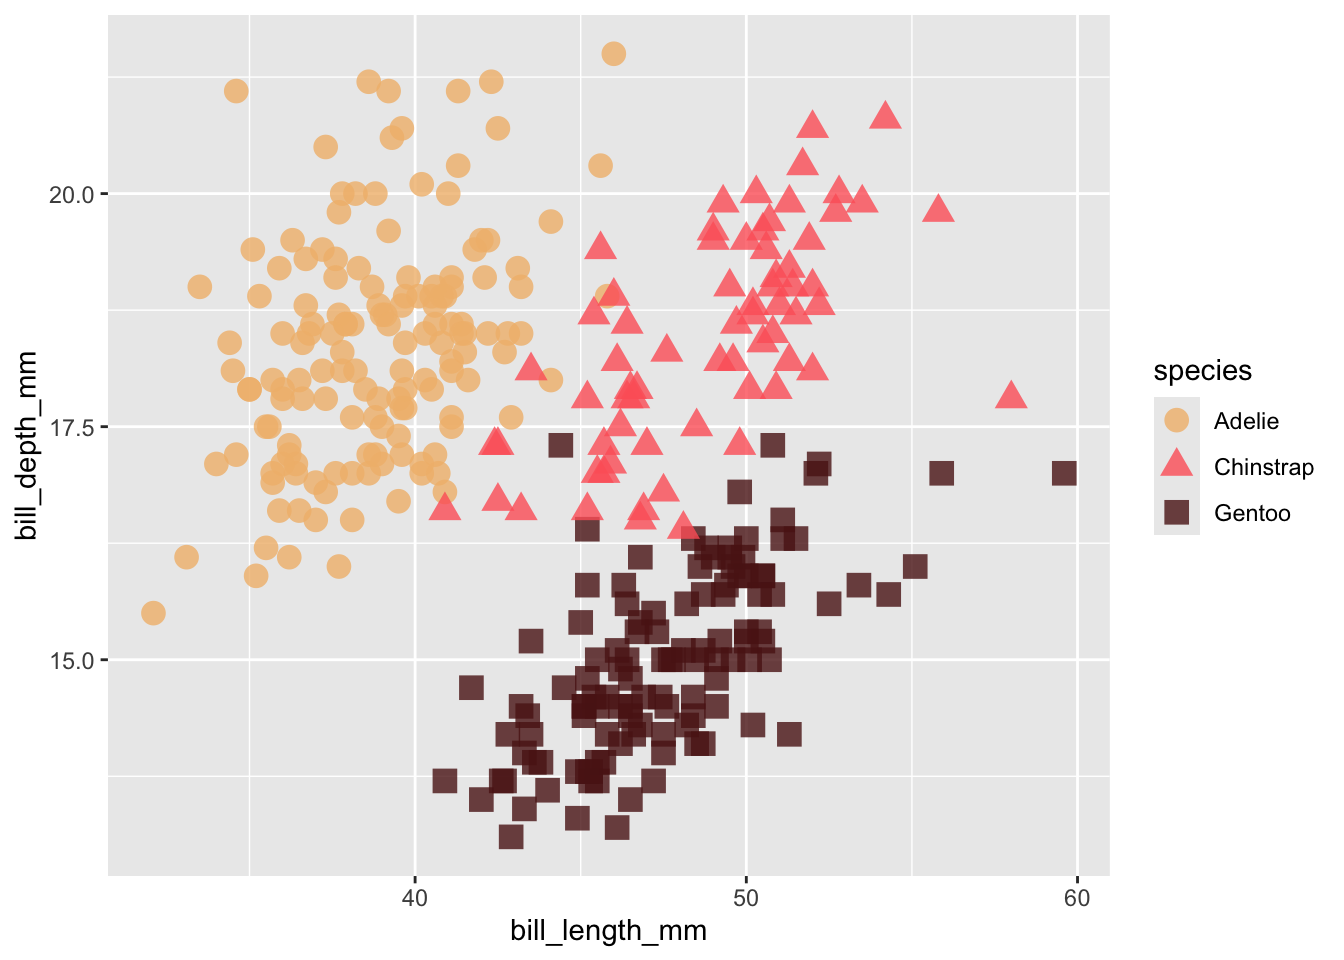
<colors>
#F9CCF9FF #F19D6BFF #818231FF #215F61FF #001959FF 
#.........................create palette.........................
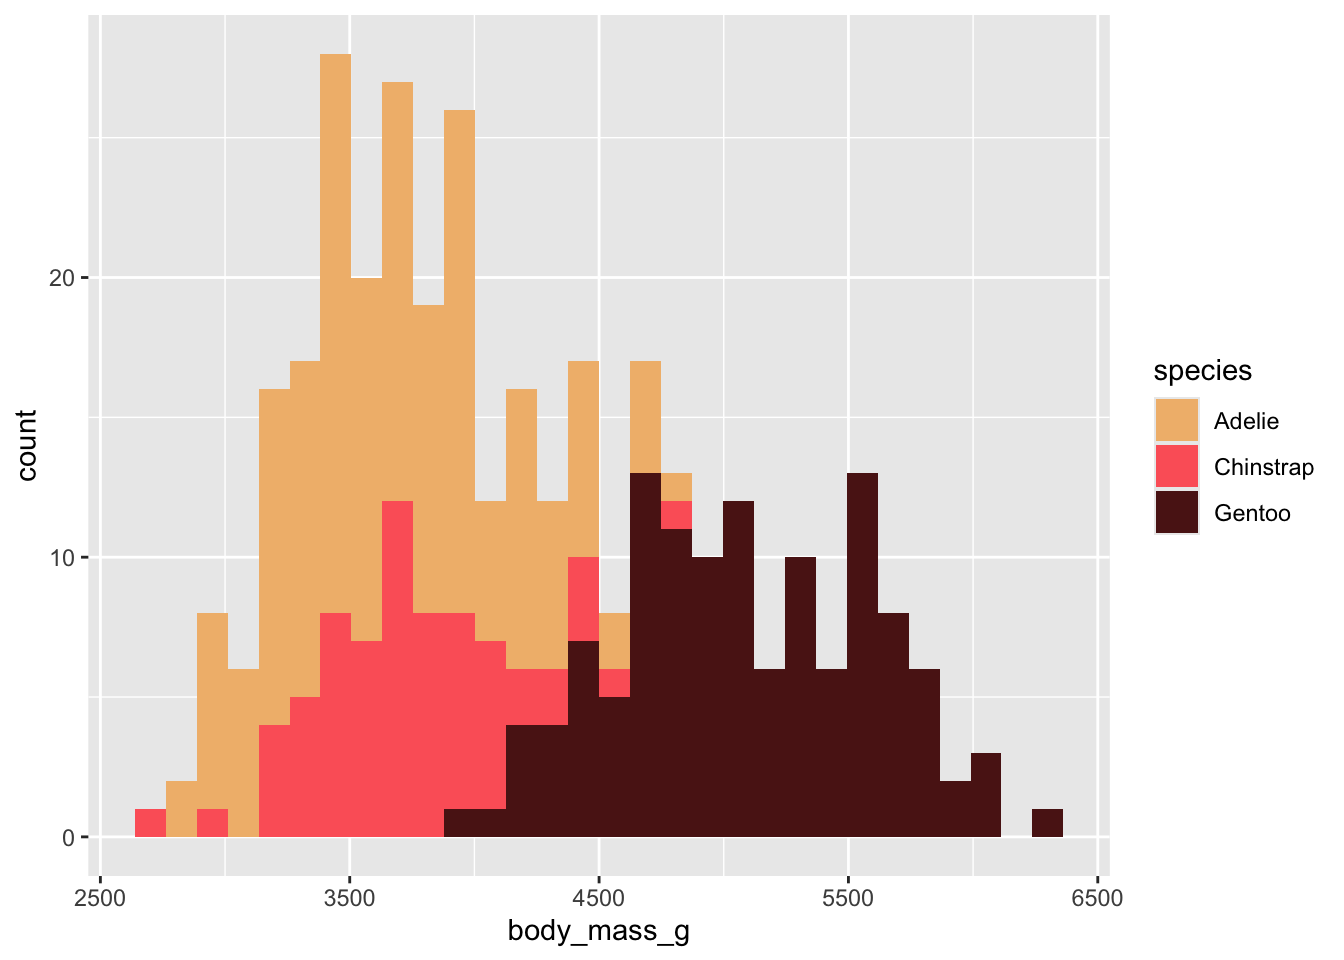
my_palette_named <- c("Adelie" = "#32DE8A","Chinstrap" = "#E36414", "Gentoo" = "#0F4C5C")
#..................apply to plot (all penguins)..................
ggplot(penguins, aes(x = bill_length_mm, y = bill_depth_mm, color = species)) +
geom_point(size = 4, alpha = 0.8) +
scale_color_manual(values = my_palette_named)